Sidebar

Main Menu Mobile

  • Home
  • Blog(s)
    • Marco's Blog
  • Technical Tips
    • MySQL
      • Store Procedure
      • Performance and tuning
      • Architecture and design
      • NDB Cluster
      • NDB Connectors
      • Perl Scripts
      • MySQL not on feed
    • Applications ...
    • Windows System
    • DRBD
    • How To ...
  • Never Forget
    • Environment
  • Search
TusaCentral
  • Home
  • Blog(s)
    • Marco's Blog
  • Technical Tips
    • MySQL
      • Store Procedure
      • Performance and tuning
      • Architecture and design
      • NDB Cluster
      • NDB Connectors
      • Perl Scripts
      • MySQL not on feed
    • Applications ...
    • Windows System
    • DRBD
    • How To ...
  • Never Forget
    • Environment
  • Search

MySQL Blogs

My MySQL tips valid-rss-rogers


MySQL Belgian Days and FOSDEM 2026: My Impressions

Details
Marco Tusa
MySQL
17 February 2026

First of all, I want to say a huge thank you to Frederic Descamps and the entire team who worked on the MySQL Belgian Days. I was thrilled to see the high number of presentations and the excellent quality across the board. We had two rooms packed with attendees, and the event was simply great. It was also incredibly productive to finally reconnect with so many people in the community face-to-face.

Presentation-wise, I was really impressed by Vitor Oliveira (Huawei) and his talk, "Beyond Linear Read-Ahead: Logical Prefetching using Primary and Secondary Indexes in InnoDB." I found the presentation and the work behind it fascinating. It perfectly explained something that I, along with several colleagues, had empirically proven in the field regarding InnoDB old pages and their impact on performance. I strongly suggest reviewing this presentation.

Another highly interesting talk, even if I feel its full power wasn't grasped by everyone in the room, was Arnaud Adant's session on MySQL Binary Log Analytics. The level of detail we can dig into and the way he handled the binlog was excellent. It was a great demonstration of how a well-known topic like the binlog can still hold a few surprises and remain highly relevant, especially when looking at real-world, large-scale scenarios.

During the Belgian Days, I also received the MySQL Legend award, which was totally unexpected for me. It was so unexpected, in fact, that after the final Rockstar nomination, I actually walked out of the room and missed Fred announcing my name! In pure Grinch style, Fred had to come out and drag me back in. I was so embarrassed here is the video of my momentary shame.

Now, what about FOSDEM? Well, FOSDEM is chaos, as we all know, and nobody expects anything less. However, this year we had a single database room for just one day. That meant trying to cram a whole universe into a single jar. As a result, the room was completely full, but the speeches were, at least for me, a bit too high-level and generic. I understand that was the intention given the constraints, but we need to keep this in mind for the future. Ultimately, I wasn't really impressed.

The day after, we had the MariaDB Day, which featured some interesting talks, specifically focusing on what is coming next for MariaDB. I had a few great discussions there and hope we will be able to collaborate when performing future tests.

The Summit for the MySQL Community

Last but not least, on Monday, February 2nd, we held the Summit for the MySQL Community. The event was an open discussion about how we, as a community, can work together to keep the MySQL ecosystem not just alive, but thriving and effective. It was an excellent meeting featuring people from AWS, Bloomberg, Booking, Canonical, WordPress, Oracle, Percona, MariaDB, and more. I don't have the full list, but it was amazing to see everyone together and willing to collaborate.

What became clear to everyone is that our scope is the same. No matter what company we come from, we want to ensure the MySQL/MariaDB/Percona/Whatever-flavor ecosystem continues to meet user needs and expands to tackle upcoming challenges. To do this, we need to focus on improving community interaction, code sharing, and evolution, without getting derailed by useless debates about who is the latest shining rockstar.

The intention is to do this together, Oracle included, assuming they take the right steps. In this regard, there is an open letter to Oracle that we are asking everyone to read; if you agree with its principles, please sign it.

Looking Forward: The Foundation and Ecosystem

Finally, I want to wish the best of luck to Fred (LeFred), who has decided to move on from Oracle and join the MariaDB Foundation, as he announced in his recent blog post. However, I also want to take a moment to answer the question he posed in that post:

"There is an initiative to create a foundation to ‘save’ MySQL, but doesn’t such a foundation already exist? There is a viable alternative for MySQL users: MariaDB. It offers more features, is ready to innovate further, and welcomes your contributions. Let’s work together!"

To answer Fred's question directly: No, that specific, overarching foundation does not quite exist yet and that is exactly what became so clear during Monday's summit. The fact that the MariaDB Foundation is there is fantastic, and we all view it as a vital piece of the larger puzzle we debated.

However, we also recognize that no single entity or fork can accomplish this broader mission alone. The goal of this new foundation initiative isn't to compete with MariaDB, but to build a unified, vendor-neutral space that lifts up the entire ecosystem.

So, let us stay focused on the greater good. Rather than trying to shift entirely into one court or the other, let's build a truly collaborative foundation where all flavors and contributors can thrive together. We have a lot of work ahead of us let's do it side by side.

No comments on “MySQL Belgian Days and FOSDEM 2026: My Impressions”

joins... joins... everywhere

Details
Marco Tusa
MySQL
16 February 2026


I have a curse. My curse is curiosity. 

Here in Percona I found one person that is very “dangerous” for me, and he and I also share the same first name, well almost, Marcos Albe. 

Marcos is a smart guy with a lot of ideas, and he is not shy to share them. One day we were talking about sysbench, and he mentioned to me: you know it would be nice to have a test for joins in sysbench. I wonder why we don’t have it; it will be so useful to identify regressions in that area.
You see where this is going right? He put that in my mind, luckily I was busy with other stuff and I forgot. Until one day. That day I had to take a more in-depth look at some claims about joins performance regressions. In that moment Marcos voice comes back as an echo resonating in my mind … it would be useful to identify regressions… 

That’s it. Ok let’s do it, let’s build this joins test and see how it goes, and shut Marcos up.

I used sysbench as an engine but then I diverged a lot while implementing the test in lua. My idea was to build a simple test but got trapped in the mechanism and (never ask AI) at the end I came up with 41 different tests and a quite complicated table(s) definition. 

Let’s see both together.

Table(s) structure

In the new test we have two different sets of tables, the main table and the level table. The main table name can be renamed as you like using the usual sysbench parameter table_name, the level table name is fix levelX and for now you have queries with only one level or all of them. Already planning to make this customizable but for now it is like that.  

The main table structure is as follows:

CREATE TABLE `%s%d` (
      `id` %s,
      l1_id INT,           -- Foreign key to level1.id
      l2_id INT,           -- Foreign key to level2.id
      l3_id INT,           -- Foreign key to level3.id
      l4_id INT,           -- Foreign key to level4.id
      l5_id INT,           -- Foreign key to level5.id
      -- Numeric data types
      small_number SMALLINT,
      integer_number INT,
      myvalue BIGINT,
      decimal_number DECIMAL(10, 2),
      float_number FLOAT,
      -- String data types
      char_field CHAR(10),
      varchar_field VARCHAR(255),
      color VARCHAR(50),
      continent VARCHAR(255),
      uuid VARCHAR(36) CHARACTER SET latin1,
      uuid_bin BINARY(16),
      text_field TEXT,
      -- Date and time data types
      datetime_field DATETIME,
      timestamp_field TIMESTAMP DEFAULT CURRENT_TIMESTAMP,
      year_field YEAR,
      -- Binary data types
      binary_field BINARY(50),
      varbinary_field VARBINARY(255),
      -- Special data types
      enum_field ENUM('active', 'inactive', 'pending'),
      set_field SET('read', 'write', 'execute', 'delete'),
      -- Boolean type
      is_active BOOLEAN DEFAULT TRUE,
      -- Spatial data type (if using GIS)
      -- point_field POINT,
      -- Constraints
      UNIQUE KEY unique_varchar (uuid),
      INDEX idx_l1_id (l1_id),
      INDEX idx_l2_id (l2_id),
      INDEX idx_l3_id (l3_id),
      INDEX idx_l4_id (l4_id),
      INDEX idx_l5_id (l5_id),
      INDEX idx_date (datetime_field),
      INDEX idx_time (timestamp_field),
      INDEX idx_enum_field (enum_field),
      INDEX idx_set_field (set_field),
      INDEX idx_year_field (year_field),
      INDEX comp_attributes(continent,enum_field,set_field),
      INDEX comp_color(color,continent,enum_field,year_field)
)

As you can see the main table has many more attributes and datatypes than the simple test existing in the basic sysbench and more than my other windmills test. 

It also has several attributes with variable length, this is to be able to emulate cases where unordered pages are present, which is the common case in production. (see also https://www.tusacentral.net/joomla/index.php/mysql-blogs/186-innodb-page-merging-and-page-splitting). To achieve that you just need to generate write traffic on the main tables, this is not available yet in the test but is not difficult to implement. As such at the moment we should consider the test executed always on Ordered pages.

Level table structure:

CREATE TABLE `%s%d` (
      `id` %s,
      continent VARCHAR(45) NOT NULL,
      parent_id BIGINT,  -- For hierarchical structure if needed
      time_accessed TIMESTAMP DEFAULT CURRENT_TIMESTAMP ON UPDATE CURRENT_TIMESTAMP,
      l1_id INT,
      l2_id INT,
      l3_id INT,
      l4_id INT,
      l5_id INT,   
      record_name CHAR(36),
      record_code CHAR(5),
      record_value BIGINT,
      record_status ENUM('active', 'inactive', 'pending'),
      record_priority INT NOT NULL,
      INDEX idx_country (continent),
      INDEX idx_parent_id (parent_id),
      INDEX idx_l1_id (l1_id),
      INDEX idx_l2_id (l2_id),
      INDEX idx_l3_id (l3_id),
      INDEX idx_l4_id (l4_id),
      INDEX idx_l5_id (l5_id),
      INDEX idx_time_accessed (time_accessed),
      INDEX idx_record_status (record_status),
      INDEX idx_record_priority (record_priority),
      INDEX comp_record_continent_status_priority(continent,record_status,record_priority)

In this case the table structure is much simpler (than main) and it has only one attribute (Country) which is Variable, this to reduce the possibility to have unordered pages to the minimum.

The Tests

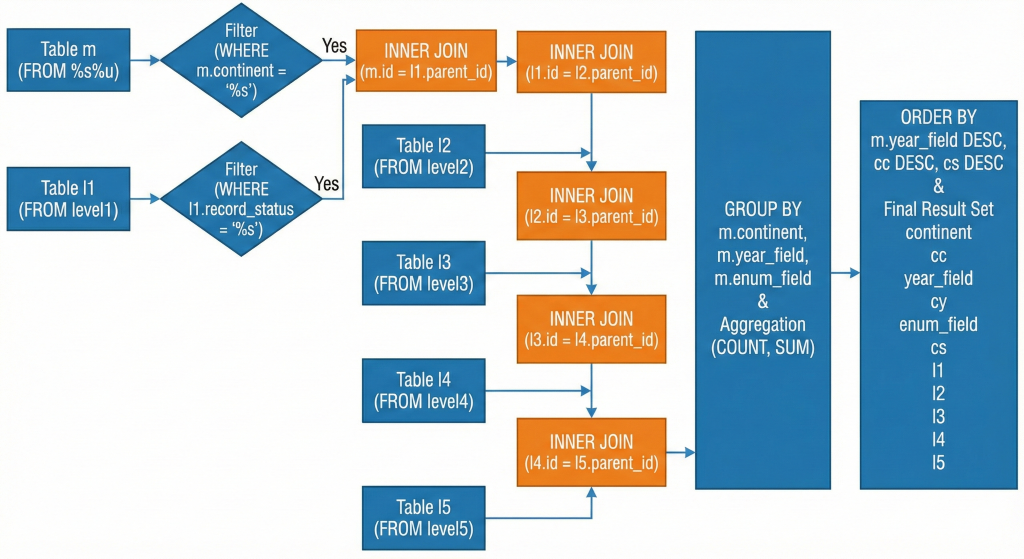
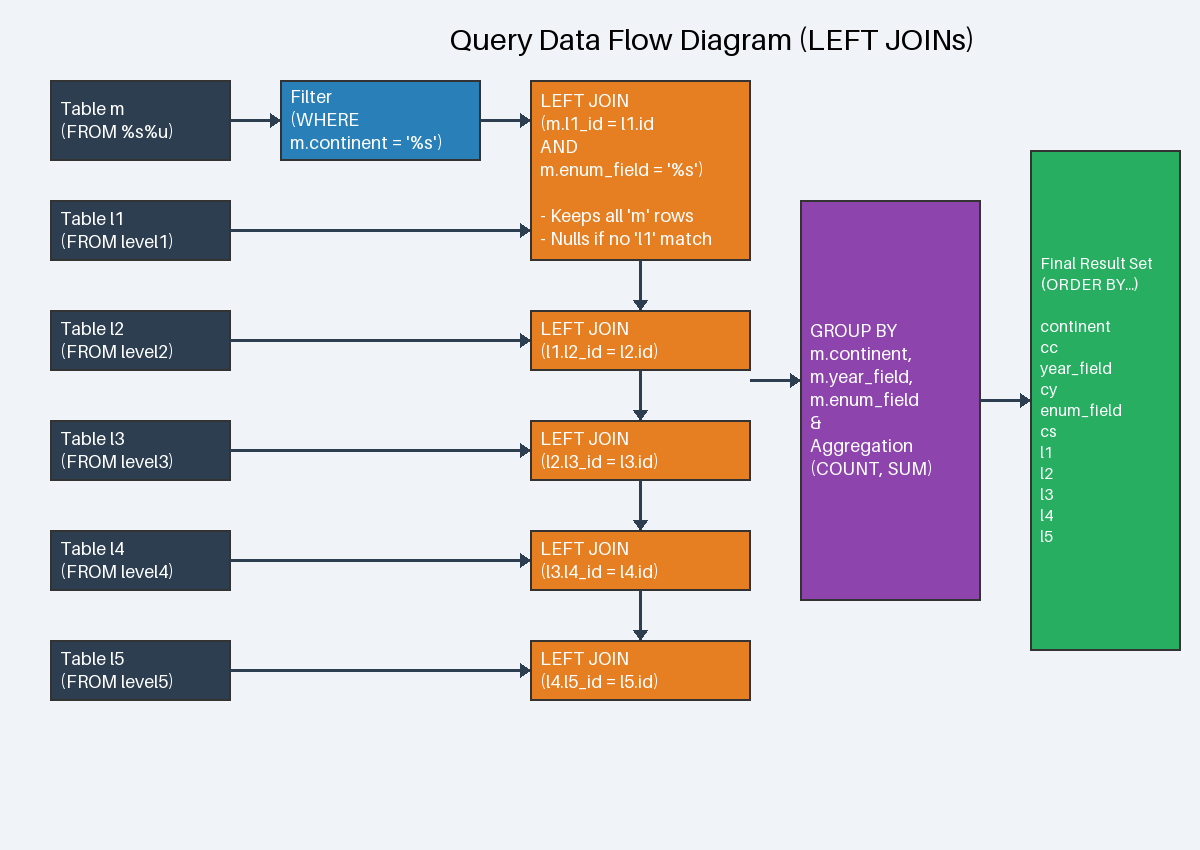
Now combining the tables I have built the following scenarios:

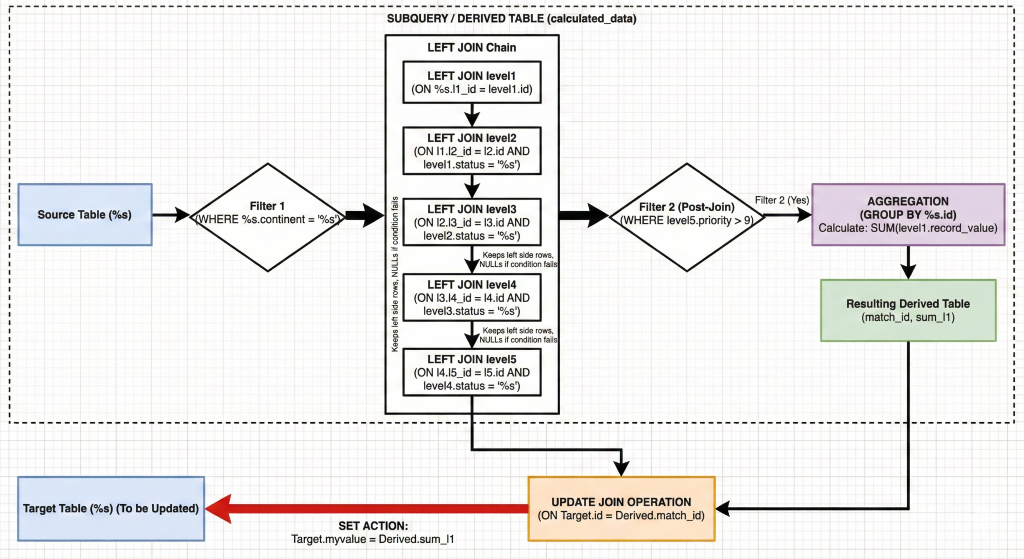
·         insert_update_delete_queries
·         inner_queries
·         left_queries
·         right_queries
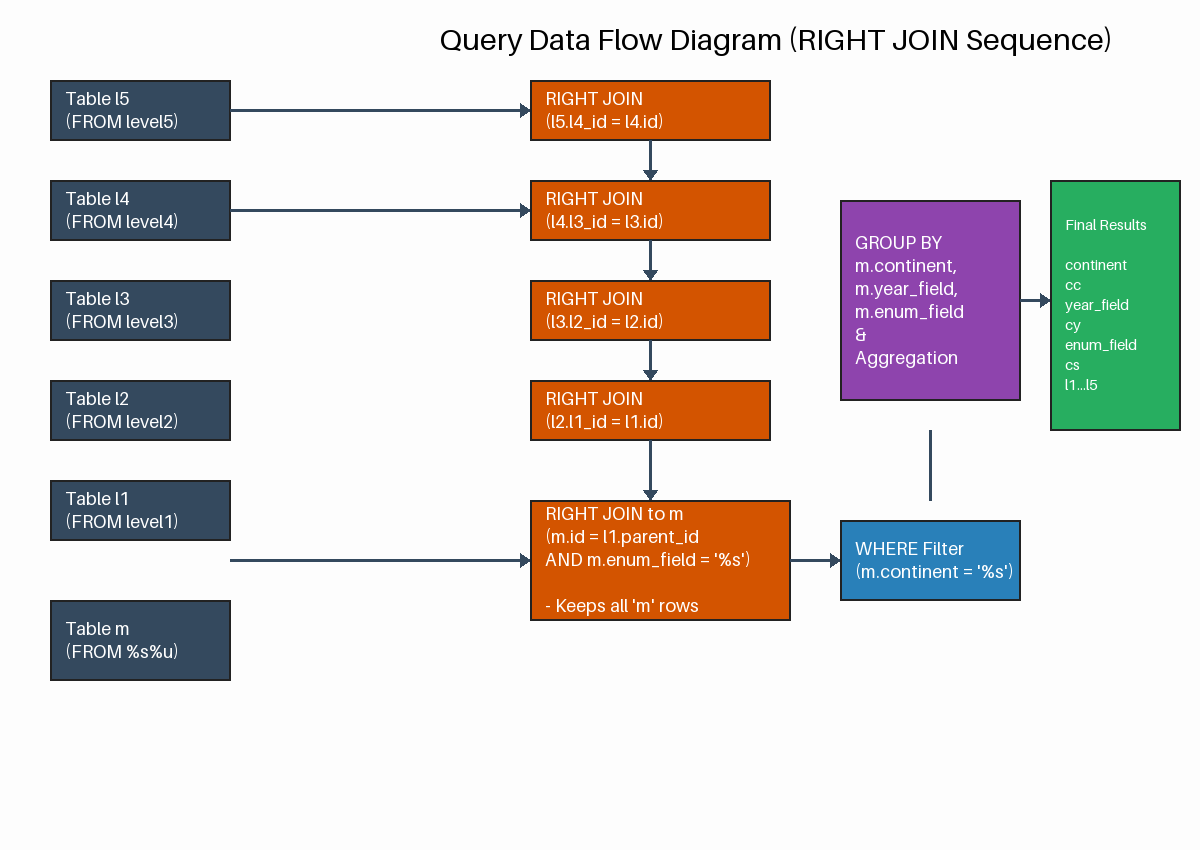
Pro-Tip from Celko: Avoid RIGHT JOIN whenever possible. It is mathematically equivalent to a LEFT JOIN with the tables swapped. Using only LEFT JOIN makes your queries more readable and follows the "natural" left-to-right reading order of SQL.

·         semi_join & anti join condition_queries
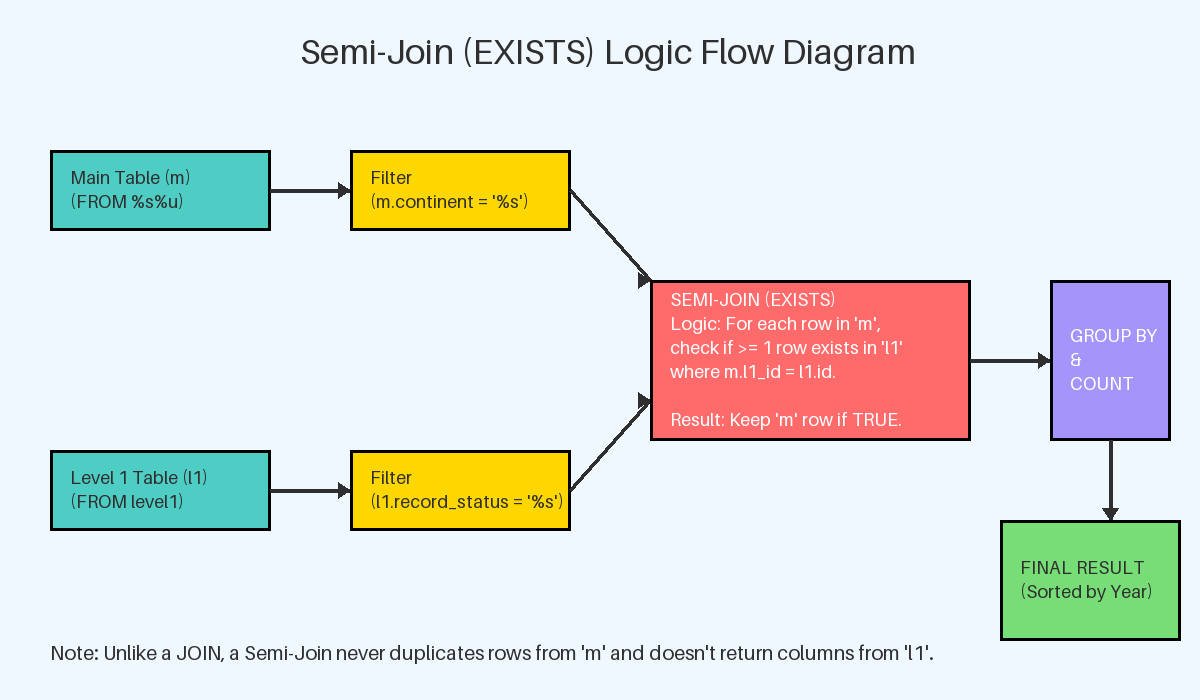
·         subquery_queries
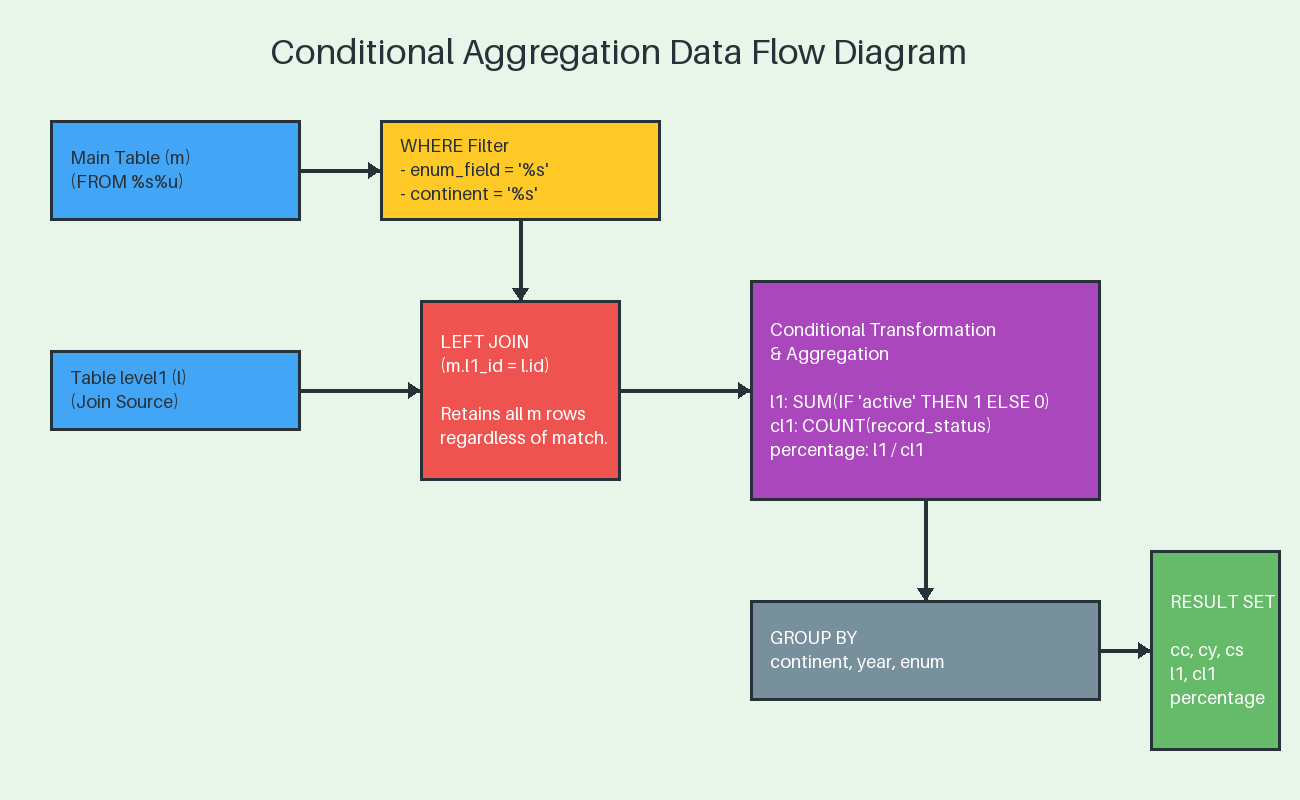
Using the above I have built the following scenarios:

  •    anti_join_left_join_pk 
  •    anti_join_not_exists_pk 
  •    conditional_join_pk 
  •    inner_subquery_multi_pk 
  •    left_subquery_multi_pk 
  •    multi_left_forcing_order 
  •    multi_left_index 
  •    multi_left_pk 
  •    multi_left_straight 
  •    multilevel_inner_forcing_order_index 
  •    multilevel_inner_index 
  •    multilevel_inner_pk 
  •    multilevel_inner_straight_index 
  •    multi_right_forcing_order 
  •    multi_right_index 
  •    multi_right_pk 
  •    multi_right_straight 
  •    right_subquery_multi_pk 
  •    semi_join_exists_pk 
  •    simple_inner_forcing_order 
  •    simple_inner_index 
  •    simple_inner_index_GB 
  •    simple_inner_pk 
  •    simple_inner_pk_GB 
  •    simple_inner_straight 
  •    simple_left_exclude 
  •    simple_left_forcing_order 
  •    simple_left_index 
  •    simple_left_index_GB 
  •    simple_left_pk 
  •    simple_left_pk_GB 
  •    simple_left_straight 
  •    simple_right_forcing_order 
  •    simple_right_index 
  •    simple_right_index_GB 
  •    simple_right_pk 
  •    simple_right_pk_GB 
  •    simple_right_straight 
  •    update_multi_inner_join_pk 
  •    update_multi_left_join_pk 
  •    update_multi_right_join_pk

Where simple means only one level of joins while multi is all the five levels. 

If you want to review them you can easily do it reviewing the file in github (https://github.com/Tusamarco/sysbench/blob/master/src/lua/joins/join_queries.lua)

Please keep in mind a couple of things:

  1. This is just a start; I do not pretend to cover all and I am open to add whatever it will be identified as useful.

  2. You are encouraged to test and modify any part of the code, query, table structure and share your changes, the more we work on this together the better it will be. 

How to use it

First clone the repo as usual, build sysbench and install it, instructions here(https://github.com/Tusamarco/sysbench/tree/master?tab=readme-ov-file#build-and-install). 

Unless you do it manually the tests in the src/lua/… will not be copy over if you want you can modify the file https://github.com/Tusamarco/sysbench/blob/master/src/lua/Makefile.am to have them installed with make install.

As usual the first step is to create and populate the schema:

sysbench /opt/sysbench/src/lua/joins/oltp_read_write.lua  --mysql-host=<ip> --mysql-port=<port> --mysql-user=<user> --mysql-password=<pw> --mysql-db=joins --db-driver=mysql  --report-interval=1  --table_name=main  --tables=15 --table_size=100000 --threads=15  prepare

This will create 15 main tables and 5 levelX tables, both with 100000 rows.

I suggest you create a schema with a decent number of rows, in general the dimension of all rows in a table should exceed the allocated memory buffer. So, if you have a 10GB Innodb buffer pool, it would be nice to have each table to be at least 15GB.

Always do a warmup, that will fill the BP with data, most likely from the last main table, but this is fine, you just want the BP to be hot. 

Once done you can run the tests. 

To evaluate the join execution, I think that the most immediate metric is the execution time. Given that when you run the test you should set –time=0 –events=X where X is the number of events you want to execute. 

How many queries will an event have? Easy, if you define it as a parameter, by default all the joins are set to 0, which means disable and you need to enable it. 

For instance if you want to execute simple_inner_pk test, you need to set --simple_inner_pk=1 where 1 is the number of occurrence, so if you set it to 1 you have one event one query, if you set --simple_inner_pk=2 you have that each event generate 2 queries… and so on. 

Given the time taken is captured for the whole test, my advice is to keep the occurrence to 1 and eventually check/test how the platform scales by concurrent threads.

To do so, you need to set the number of events and threads to the same value. 

See a full example below:

sysbench /opt/sysbench/src/lua/joins/oltp_read_write.lua  --mysql-host=<ip> --mysql-port=<port> --mysql-user=<user> --mysql-password=<pw> --mysql-db=joins --db-driver=mysql  --skip_trx=off --report-interval=1  --histogram --table_name=main  --stats_format=csv --tables=15 --table_size=1000000 --time=0 --multilevel_inner_pk=1 --events=5 –threads=5 run

This will record the time taken to execute 5 queries in parallel.

While you can enable more than one test at the same time, to me this is not useful given it will be not clear who is taking longer unless you do not keep track of that in other ways, like slow query log or performance schema.  


How to modify it

You want to modify the queries or table structure?

Do it! Just modify the file joins_queries.lua. There you will find the table definition for the main and level table.
The only thing to be careful of is to change the variables in the load_global_variables() to match your changes and of course you will need to modify the initialize_values_X for main and level table.

If instead you only want to change the queries you have two ways.

  1. Add your query to an already existing map 

  2. Create a new map

Method 1. 

Say you want to add a query for the left joins. Identify the left_queries = {…} map and add the query you want to add:

["my_custom_left_query"] = [[SELECT m.continent,year_field, m.enum_field, level1.record_value l1
FROM %s%u as m
LEFT JOIN level1 ON m.l1_id = level1.id and m.enum_field = '%s'
WHERE m.continent = '%s'
ORDER BY m.year_field DESC, l1 DESC
LIMIT 100;]],

Here I am not adding anything special, so I just need to add a pair of [KEY] = <SELECT> using the same attributes. 

In case you need to change the attributes, then you need to create a case in the function that fill the query. The function is: function execute_joins(join_name) in joins/oltp_common.lua. 

For instance if I want to have my custom query filtering by the attribute color in the main table, I can do:

["my_custom_left_query"] = [[SELECT m.continent,year_field, m.enum_field, level1.record_value l1
FROM %s%u as m
LEFT JOIN level1 ON m.l1_id = level1.id and m.enum_field = '%s'
WHERE m.color = '%s'
ORDER BY m.year_field DESC, l1 DESC
LIMIT 100;]],

In the function I can add a case like:


  if join_name:find("my_custom_left") then
     for i = 1, sysbench.opt[join_name] do
        local tnum = get_table_num()
        query = string.format(query_map[join_name .. "_query"], sysbench.opt.table_name, tnum, get_record_status(), get_color())
        -- print("DEBUG JOIN QUERY B: " .. query .." Join Name: " .. join_name)
        con:query(query)
     end

Done!

Method 2

Just respect the rules as above but instead of using the existing map, you can create your own and then add it to the list query_map = mergeMultiple. As simple as that.

How to help

As said before, this is far from a perfect or exhaustive test, it is a start and the more feedback I get the more I will be able to improve it. 

I would really like to get PR or FR with specific tasks, the closer they are to real life cases the better.

In the meantime, I wish you all happy testing.


References

Joins sysbench code

MySQL 8.4: JOIN Clause – The definitive reference for INNER, LEFT, RIGHT, and CROSS joins.

Outer Join Optimization – Explains how the optimizer handles LEFT JOIN and RIGHT JOIN and how to write efficient predicates.

Nested-Loop Join Algorithm – For those interested in the "under the hood" execution of joins in MySQL.

Index Merge Optimization – Crucial for understanding how indexes are used (or not used) during complex joins.




No comments on “joins... joins... everywhere”

The 10 TB Scale Survival Guide for Percona Operator PXC on Kubernetes

Details
Marco Tusa
MySQL
16 February 2026

"What happens when you run a 10 TB MySQL database on Kubernetes?" 


That's the question many of our customers and users asked and honestly, we were extremely curious ourselves.

So, we ditched the weekend plans, rolled up our sleeves, and jumped down the rabbit hole. What we found was far more challenging (and perhaps a bit more "psychedelic") than expected. We spent days rigorously testing the Percona Operator for PXC at massive scale. 

This blog post distills all our findings into the most critical, actionable advice you need to ensure your high-scale environment not only survives but operates reliably.

If you are lazy and prefer to watch a video, here is the presentation I did at the MySQL Belgian days in January 2026.

First of all, what environment did we use? 

Well forget about 4Gb ram or using the millesimal set on CPUs. You need heavy stuff, you need power, you need the mega-super-duper tank not the small bike, well if you can pay for it of course. Anyhow we have tested on something that is not small and not too huge as well, all in AWS/EKS.


The AWS instance type chosen for the testing environment was m7i.16xlarge, combined with an io2 storage class provisioned at 80,000 IOPS.

This configuration was selected because:

  • The m7i.16xlarge is a general-purpose instance with custom 4th Generation Intel Xeon Scalable processors, offering 64 vCPUs and 256 GiB of high-bandwidth DDR5 memory. This robust computational and memory capacity ensures that CPU or memory are unlikely to be limiting factors during initial testing of a large-scale, high-performance MySQL cluster on EKS.
  • Its 20 Gbps dedicated EBS bandwidth and up to 80,000 maximum IOPS to EBS perfectly complement the high-performance io2 Block Express storage volume.
  • By provisioning the storage to the maximum rated IOPS of the underlying instance type, the aim was to create a stress-testing environment that isolates potential performance constraints in the MySQL operator, Percona architecture, Kubernetes storage mechanisms (CSI/EBS), or database configuration, rather than hitting a hardware-imposed ceiling. This allows for a precise analysis of operational overheads and bottlenecks when the I/O subsystem is not the weakest link, which is critical when scaling a database to 10 TB of data.


Did it go as we would like to? Well long story short, not in full but I was expecting worse … into the rabbit hole we go.


We fully validated the cluster's ability to scale, but here's what surprised (and alarmed) us the most:

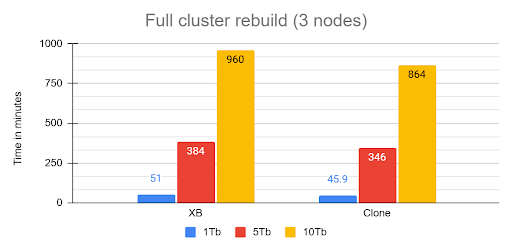
  • The 16-Hour Naptime MTTR (Mean Time To Recover): Full cluster recovery time for the 10 TB dataset clocked in at an eye-watering 960 minutes (16 hours)! If your business requires a guaranteed 1-hour Recovery Time Objective (RTO), you're going to have a very awkward conversation with your boss.

The rebuild operation from cluster crash was executed recovering the first node from snapshot then, letting the cluster recover using internal recovery mechanism.

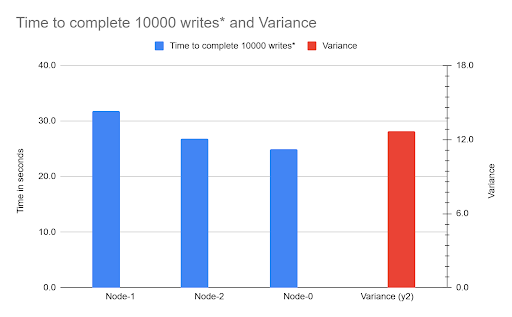
  • The Unruly Cloud Storage: We provisioned high-performance AWS EBS volumes (80,000 IOPS), yet we hit a wall due to Galera Flow Control. The root cause? One node's volume had a 21% performance degradation compared to the others. The entire synchronous cluster was choked by the single slowest volume.

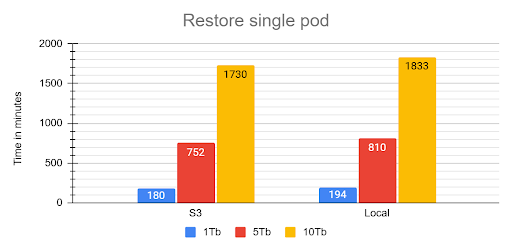
  • The Starved Recovery Container: We discovered the restore process's most time-consuming phase the single-threaded redolog apply was bottlenecked because the default recovery container only gets a laughably default memory allocation (around 100 MB). This process consumed 92% of the total restore time.

The Safe Operation Playbook: Critical Fixes

You can tame the data monster, but you have to stop using the default settings. Your focus must shift to I/O consistency, recovery optimization, and mandatory zero-downtime practices.

1. Stop Starving Your Recovery Container

The single most effective action to improve your RTO is giving the restore container more memory to efficiently process the redolog.

  • The Fix: You must override the inadequate defaults in your recovery.yaml specification.
  • Recommendation: Set memory: 4Gi and cpu: 2000m (2 full cores). This directly reduces the time spent on the single-threaded redolog apply phase, chipping away at that painful 16-hour recovery window. This will alleviate and not resolve the situation though. 
  • Redefine Recovery SLO: Since the Operator waits for full cluster recovery before HAProxy serves traffic, you must redefine your internal service goal to Minimal High Availability (HA) (two out of three nodes synced), you can achieve it increasing the size of the cluster by steps, so first one node then add the second and so on. This allows you to claim service is resumed in hours (or less, if optimized) rather than 16 hours.

2. The Cloud Storage Problem: EBS is Not Trustable

For critical, high-scale PXC clusters, the testing proved that high-cost abstracted cloud volumes (EBS) are too unpredictable due to the risk of I/O variability.

  • The Problem: I/O variance is a single point of failure that triggers Galera Flow Control. Because PXC is synchronous, if one node is 21% slower, the entire cluster is 21% slower.
  • The Long-Term Solution: For mission-critical 10 TB systems, mandate a review for dedicated storage solutions. Look for cloud alternatives that offer strict I/O guarantees, such as dedicated NVMe instances, to bypass the performance abstraction layer and ensure every node performs equally. Or opt for direct attach (fiberchannel) solutions with a SAN tune to prevent volume overlaps. 

3.  Zero-Downtime is Mandatory (Say No to Direct SQL DDL)

On a Percona XtraDB Cluster, DDL is replicated using Total Order Isolation (TOI). This means that direct ALTER TABLE operations cause a full, unacceptable table lock, resulting in downtime.

  • The Rule: Use PTOSC (Percona Online Schema Change) for all DDL, including simple index operations. It takes significantly longer, but it is the only way to avoid service interruption.
  • The Capacity Warning: PTOSC temporarily duplicates the entire target table. Ensure you have meticulous capacity planning for temporary disk space to prevent a cluster-wide storage saturation crash!
  • Large DML: Break all large UPDATE and DELETE operations into small, iterative batches (chunks) to minimize the scope and duration of transactional locks.

Hot Data Subset vs. The Whole Barn

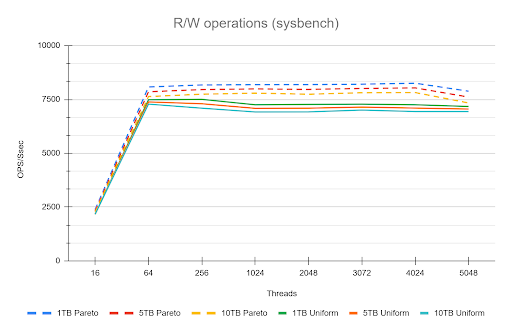
The most fascinating performance finding was how much the application's access pattern affects performance at scale. This dictates how well your InnoDB Buffer Pool can save you from a slow disk.

Access Pattern Description Performance Outcome
Skewed/Live Subset (Pareto) Application uses a small, "hot" subset of data (e.g., the last few weeks' transactions). Good. The Buffer Pool works perfectly. We saw lower I/O Wait (IOWAIT) and sustained high throughput up to 4024 concurrent threads. The 10 TB cluster runs like a 1 TB cluster.
Uniform Access Queries are distributed uniformly across the entire dataset (10 TB). Not so good. Forces high disk activity because the Buffer Pool cannot cache everything. Resulted in high IOWAIT and immediate performance degradation past the CPU limit.

Remember that the tests used a 50/50 read/write workload. Even when operating on a "hot" subset in the buffer pool, the persistent write and purge operations still required disk I/O, which likely reduced the visible performance difference (delta) between the hot subset and uniform access patterns. This delta would be larger with a higher percentage of read operations. 

The Bottom Line is that your 10 TB cluster is faster if your application keeps queries focused on the "hot" data subset. Uniform access patterns force the system to pay the full 10 TB I/O cost, every time. 

Actionable Summary for the Team

  1. Recovery Override: Set memory: 4Gi in the recovery spec to reduce the negative impact of the 92% redolog apply bottleneck.
  2. DDL Enforcement: PTOSC is mandatory for all schema changes. Batch large DML.
  3. Storage Fix: Do not trust EBS/abstracted storage for 10 TB. Plan an architectural shift toward guaranteed I/O (e.g., dedicated NVMe instances).
  4. Data Mobility: Standardize on MyDumper/Loader for all bulk operations.
  5. Data distribution/access: If You Have a Hot Data Subset, Offload the Rest. The better performance seen with the "hot" data subset (Pareto) is your green light!
    Any data your application accesses uniformly (or rarely) is only increasing your recovery time and operational cost.
    You should treat the remaining data as a candidate for immediate migration to an OLAP container or data lake, ensuring your PXC cluster remains lean and fast.

Conclusions

Ultimately, our deep dive proved that running Percona XtraDB Cluster on Kubernetes with a 10 TB dataset is less about raw scalability and more about operational rigor and resource tuning. 

The cluster is fundamentally resilient, but its success hinges on bypassing the hidden pitfalls like:

  • the unpredictable nature of abstract cloud I/O
  • the crippling cost of default recovery settings
  • the unacceptable downtime from standard DDL practices.

However we also identify some areas for improvements like in the case of full cluster recovery, we will work on that. 


The key takeaway is simple: default configurations are for small data, large datasets require deliberate engineering.


Notes:

*  In this context means: Mean Time To Recover / Restore (The "User" Metric). Which is the average time from the start of the outage until the system is fully back online and usable for the customer. Includes: Detection time + Response time + Repair time + Testing time.

No comments on “The 10 TB Scale Survival Guide for Percona Operator PXC on Kubernetes”

MySQL January 2026 Performance review

Details
Marco Tusa
MySQL
25 January 2026

This article is focused on describing the latest performance benchmarking executed on the latest releases of Community MySQL, Percona Server for MySQL and MariaDB. 

In this set of tests I have used the machine described here. 

Assumptions

There are many ways to run tests, and we know that results may vary depending on how you play with many factors, like the environment or the MySQL server settings. However, if we compare several versions of the same product on the same platform, it is logical to assume that all the versions will have the same “chance” to behave well or badly unless we change the MySQL server settings. 

Because of this, I ran the tests changing only things in a consistent way, with the intent to give the same opportunity to each solution. There is a clear assumption that if you release your product based on the defaults, that implies you have tested with them and consider them the safest for generic use. 

I also applied some modifications and ran the tests again to see how optimization would impact performance. 

What tests do we run?

High level, I run one set of test:

  • TPC-C (https://www.tpc.org/tpcc/) like 

The full methodology and test details can be found here, while actual commands are available:

  • Sysbench
  • TPC-C


Why do I (normally) only publish TPC-C tests?  

Well, I am, normally, more interested in testing scenarios that are closer to reality than a single function test as we normally do with sysbench. 

This is it, while it is not possible to get the perfect benchmark test fitting all real usage, we need to keep in mind the rule of 80%. 

If you use MySQL/InnoDB I expect that you will have an OLTP kind of traffic, more than Key/Value or else. 

Given that while testing the single function, as we do with sysbench, it may be useful to identify regression points or so. To get the wide scenario, TPC-C is a better way to go, given it implies not only a more intense write load, TPC-C test is 50/50 r/w, but also a schema structure with relations, foreign keys and constraints. In short, it is closer to the common use of a relational database management system.

However, this time things are a bit different and to be fair I must dig a bit also in the Sysbench single tests. This is making this blog a bit longer than the previous ones, but I think it is worth it and you will see why. 


Results

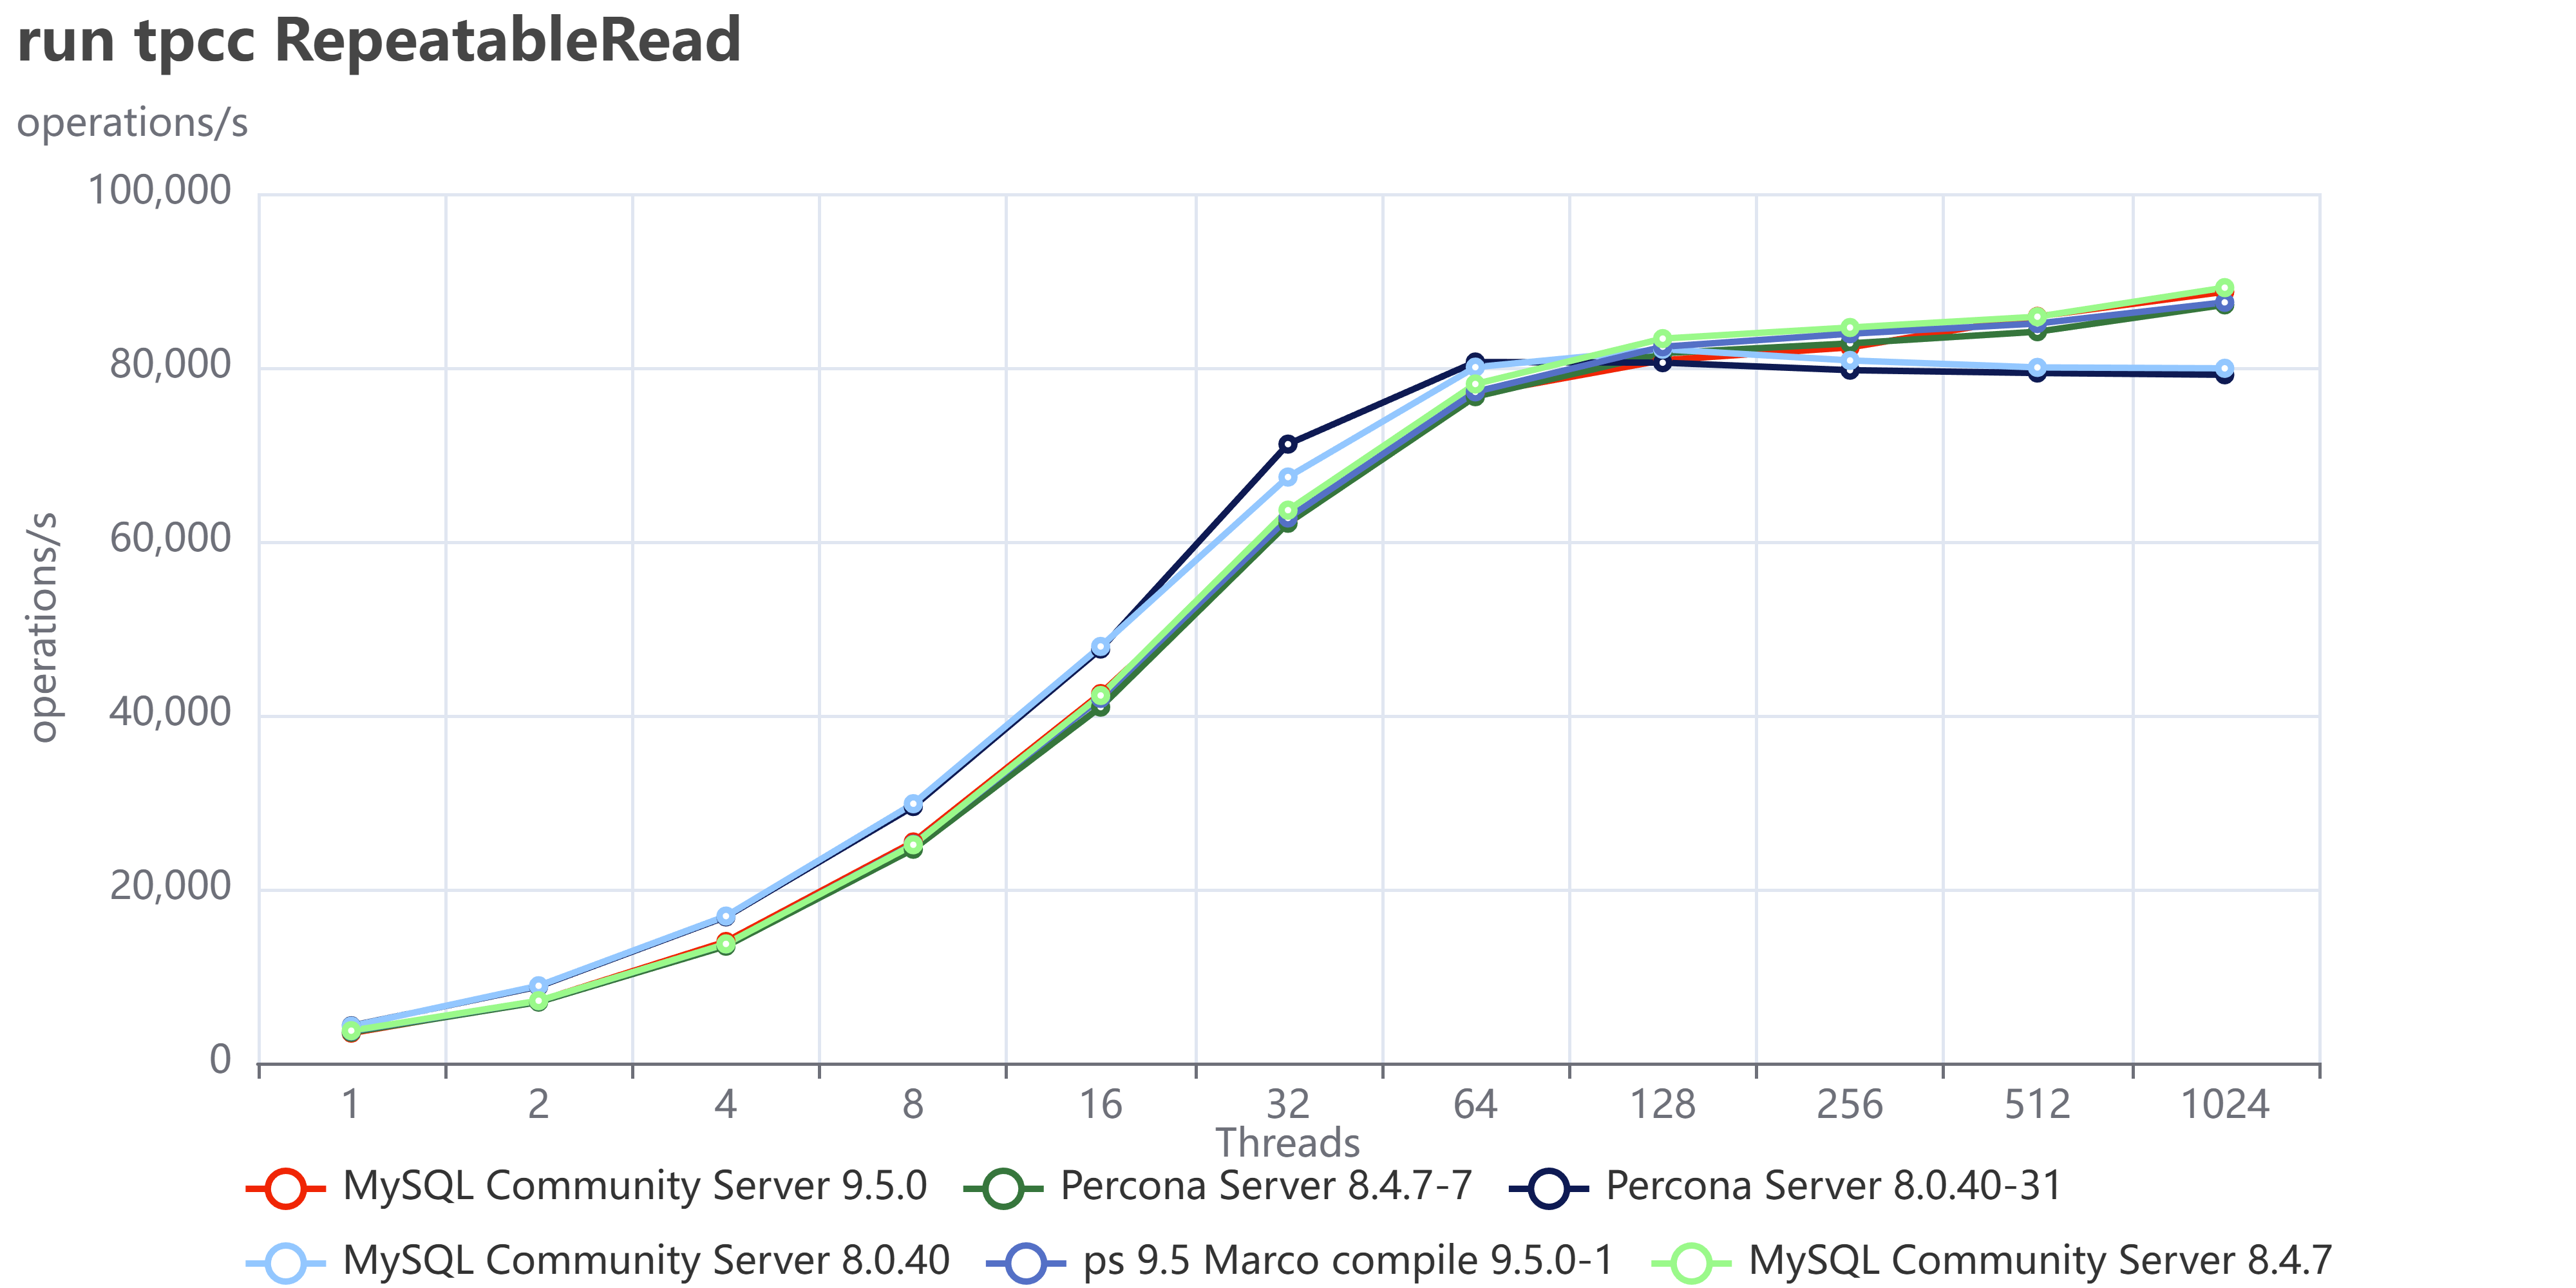
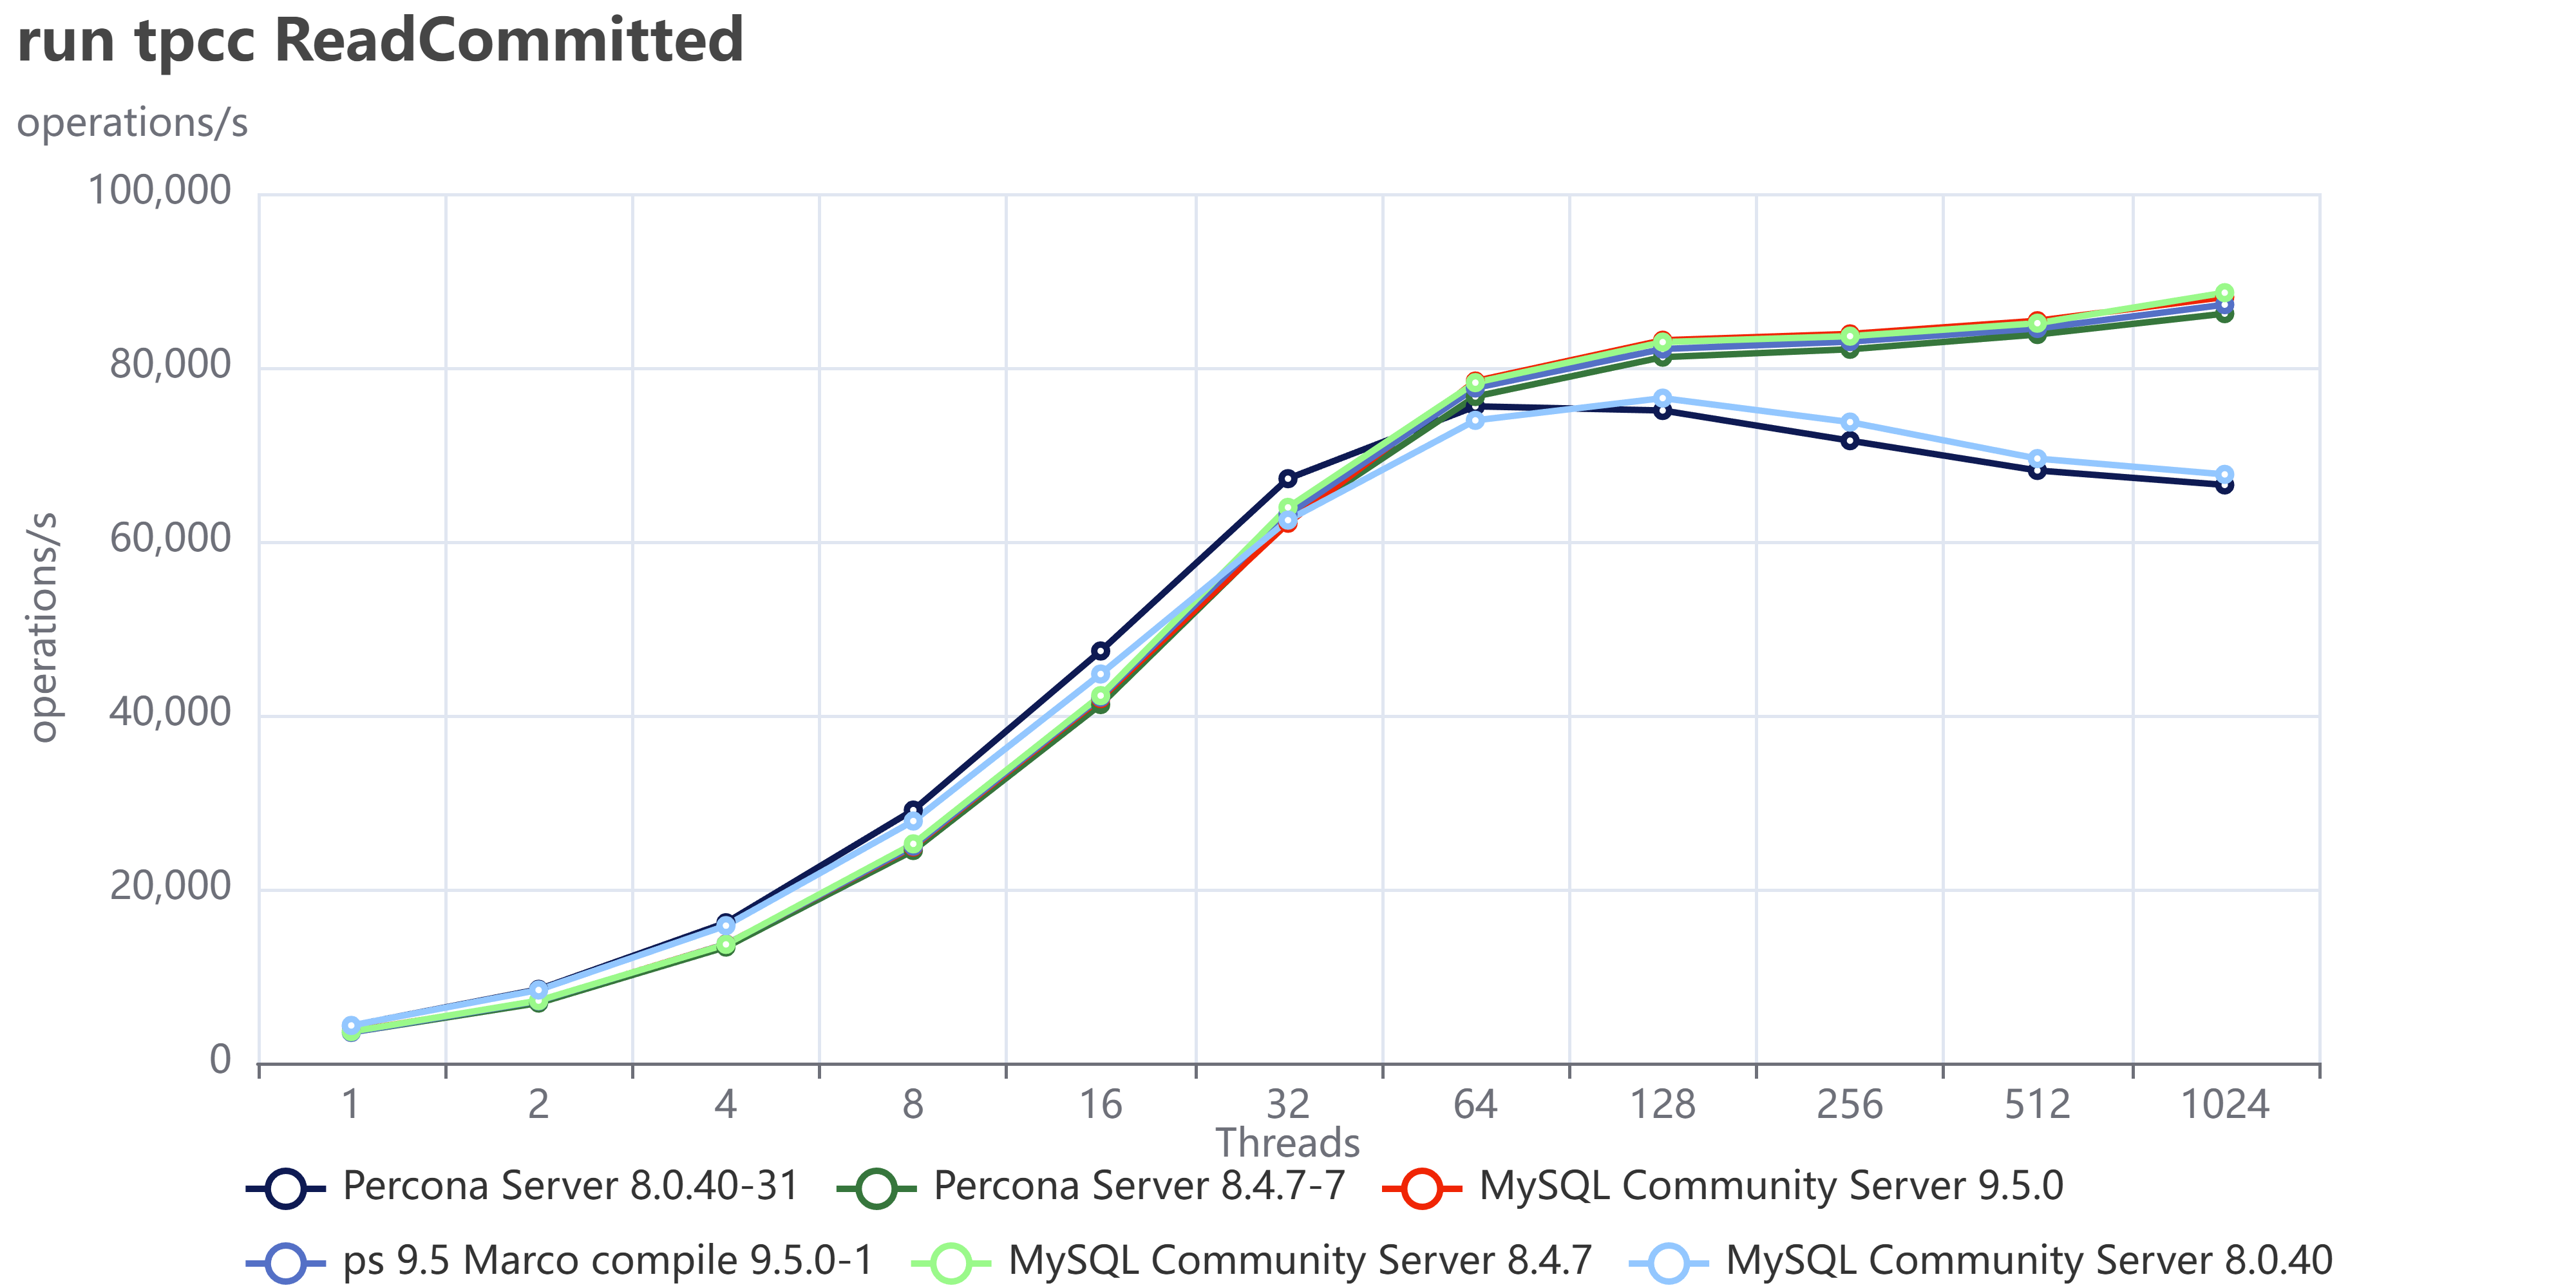
The tests done have two different kinds of isolation levels. Repeatable Read and Read Committed. The first is the default in MySQL/InnoDB, while the second is the default in many other very well-known RDBMS. 


First let us review how Community MySQL and Percona Server MySQL are doing in comparison with the previous versions, especially after the debacle we had some time ago (see https://www.tusacentral.net/joomla/index.php/mysql-blogs/256-sakila-where-are-you-going) 


This time I have finally dropped 5.7, given it's EOL from some time. (Folks, you must move out of it, if you don’t know how to do it, call us for help.) 

As usual an image is more descriptive than many words:

run tpcc ReadCommitted 8 9

run tpcc ReadCommitted 8 9

You can also compare these trends (not the values) with the previous results published here.

Let us comment a bit on these images. 


The first comment we should make is that nowadays our systems must be ready to scale; period, no discussion. Also, doing benchmarks up to 1024 threads is not enough. In the real world we have 4000 or more connections. Given that, doing benchmarking exercises and stopping the load at 128 threads or lower, makes no sense. 

This is going to be very clear in the next section. For now, what we can notice is that Percona Server and MySQL community are very close in terms of performance. The minor difference is inside the %variance so it is not relevant. This is expected given we share a large part of the code. What is relevant here is that Percona Server comes with similar/same performance and is a more feature-rich version, given that Percona Server MySQL has features that exist only in MySQL Enterprise.  


The second comment is that in previous tests, MySQL had not only stabilized the server behavior, but it has also done significant fixes to prevent the performance loss while scaling.

Now what we can see is that the newer versions are able to keep on with the traffic and are able to scale a bit more. So, in short, everything seems going good, or at least much better than before. 


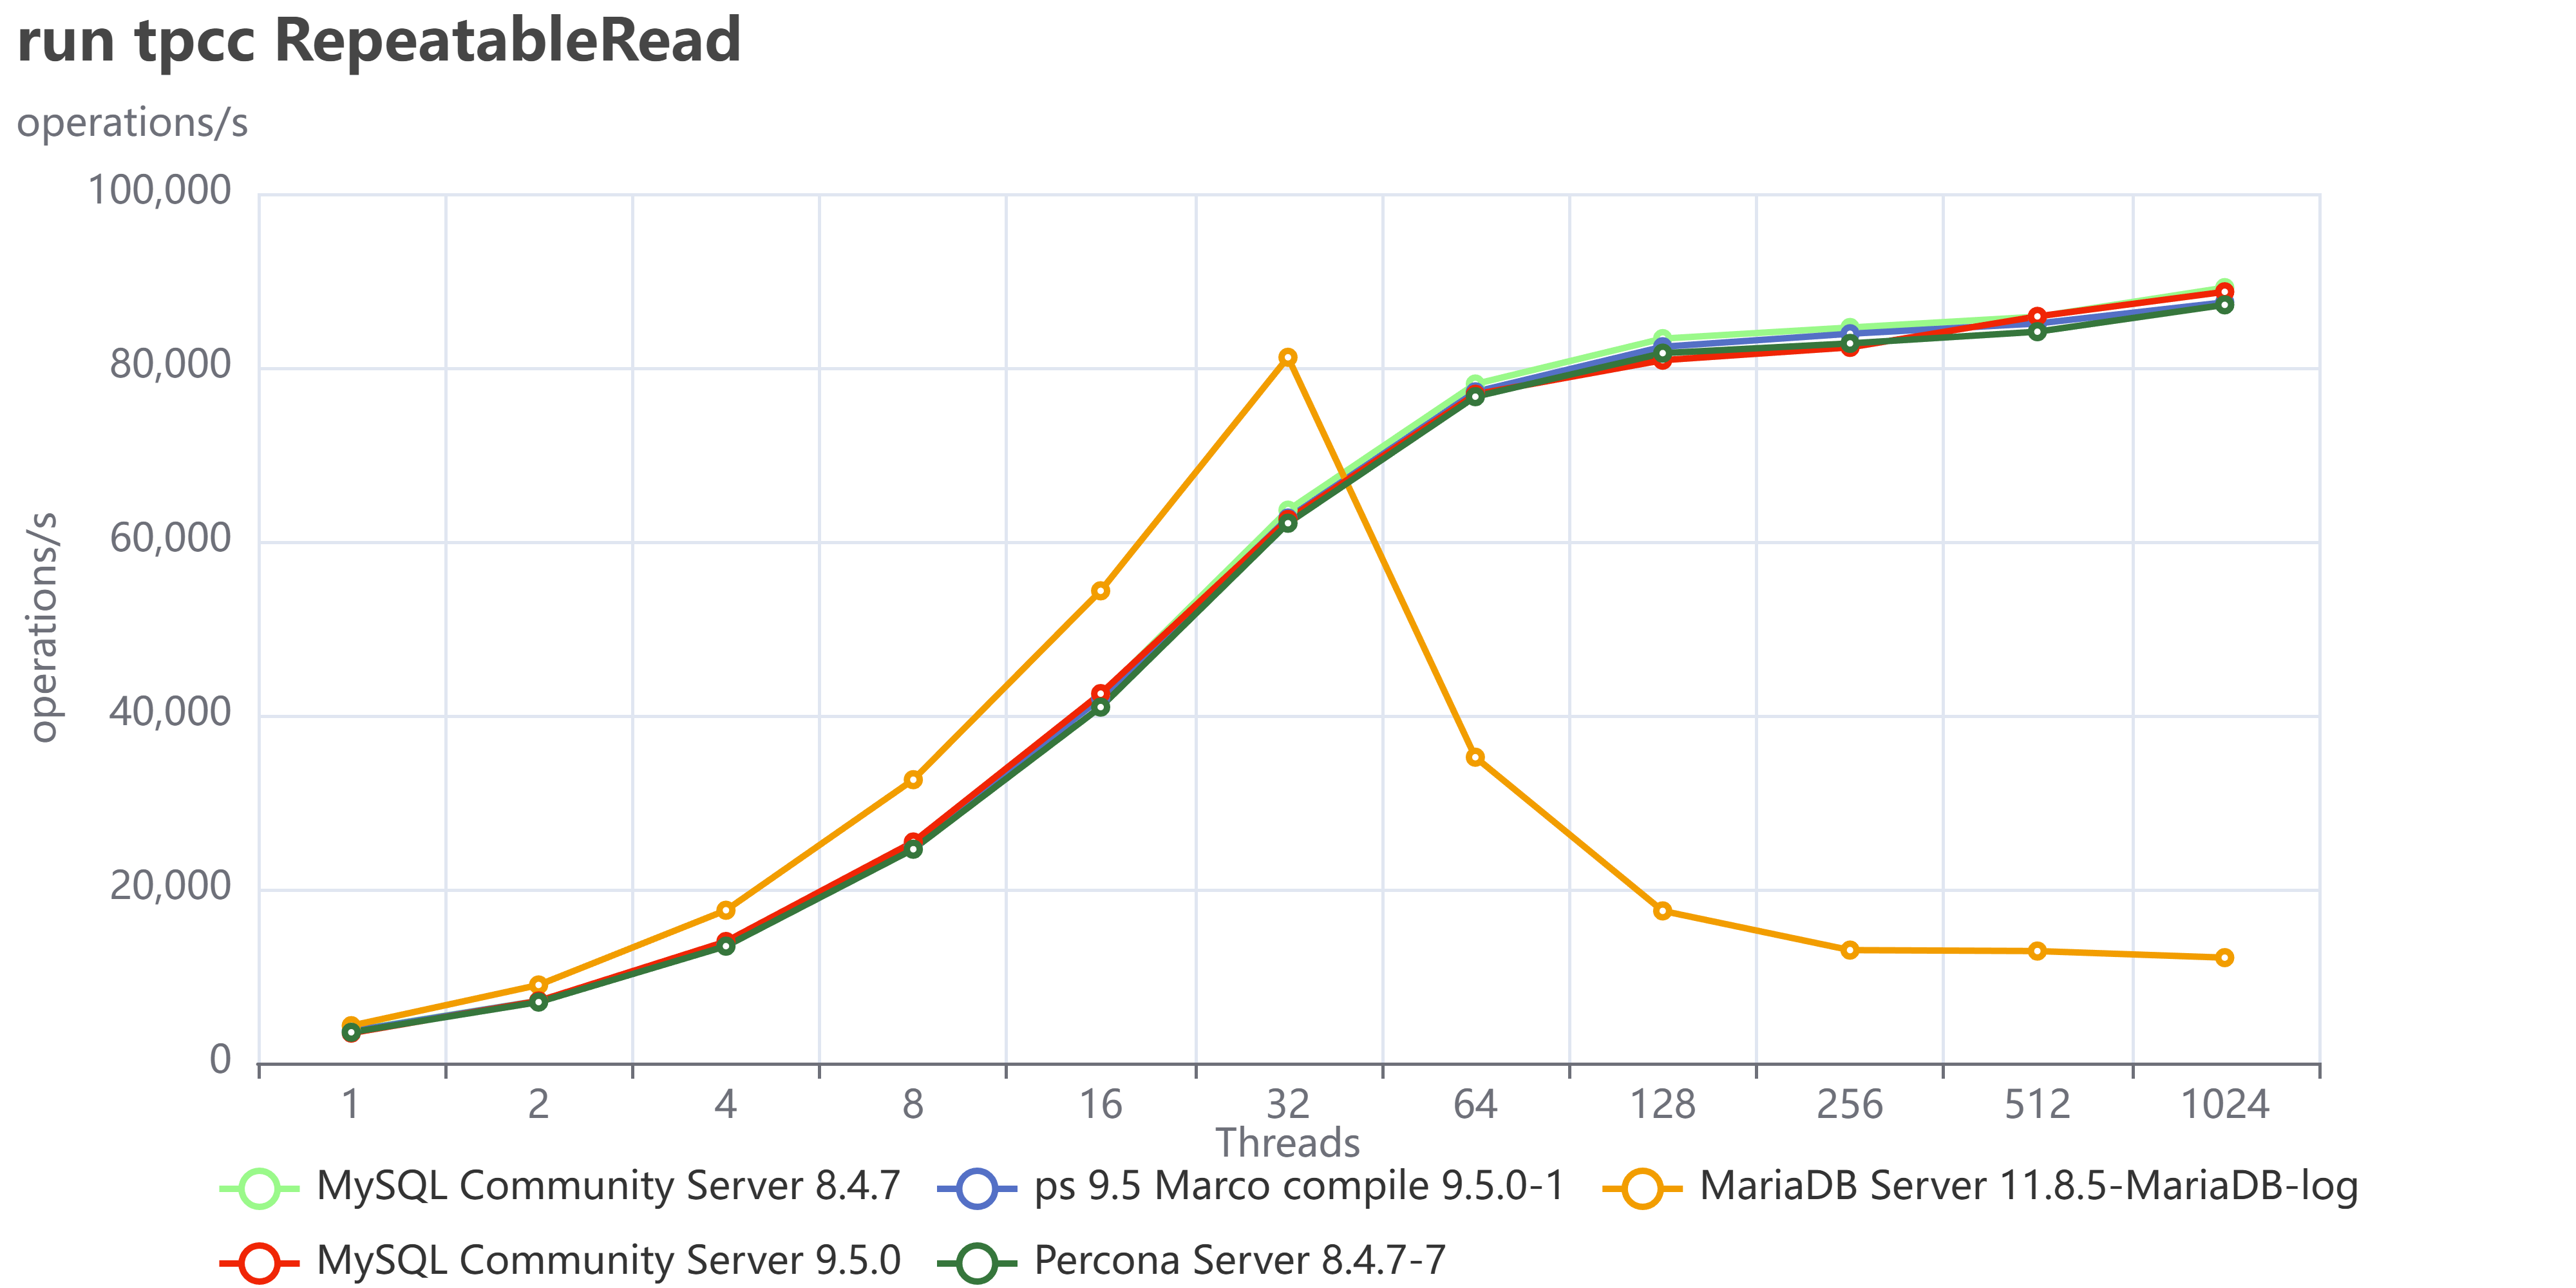
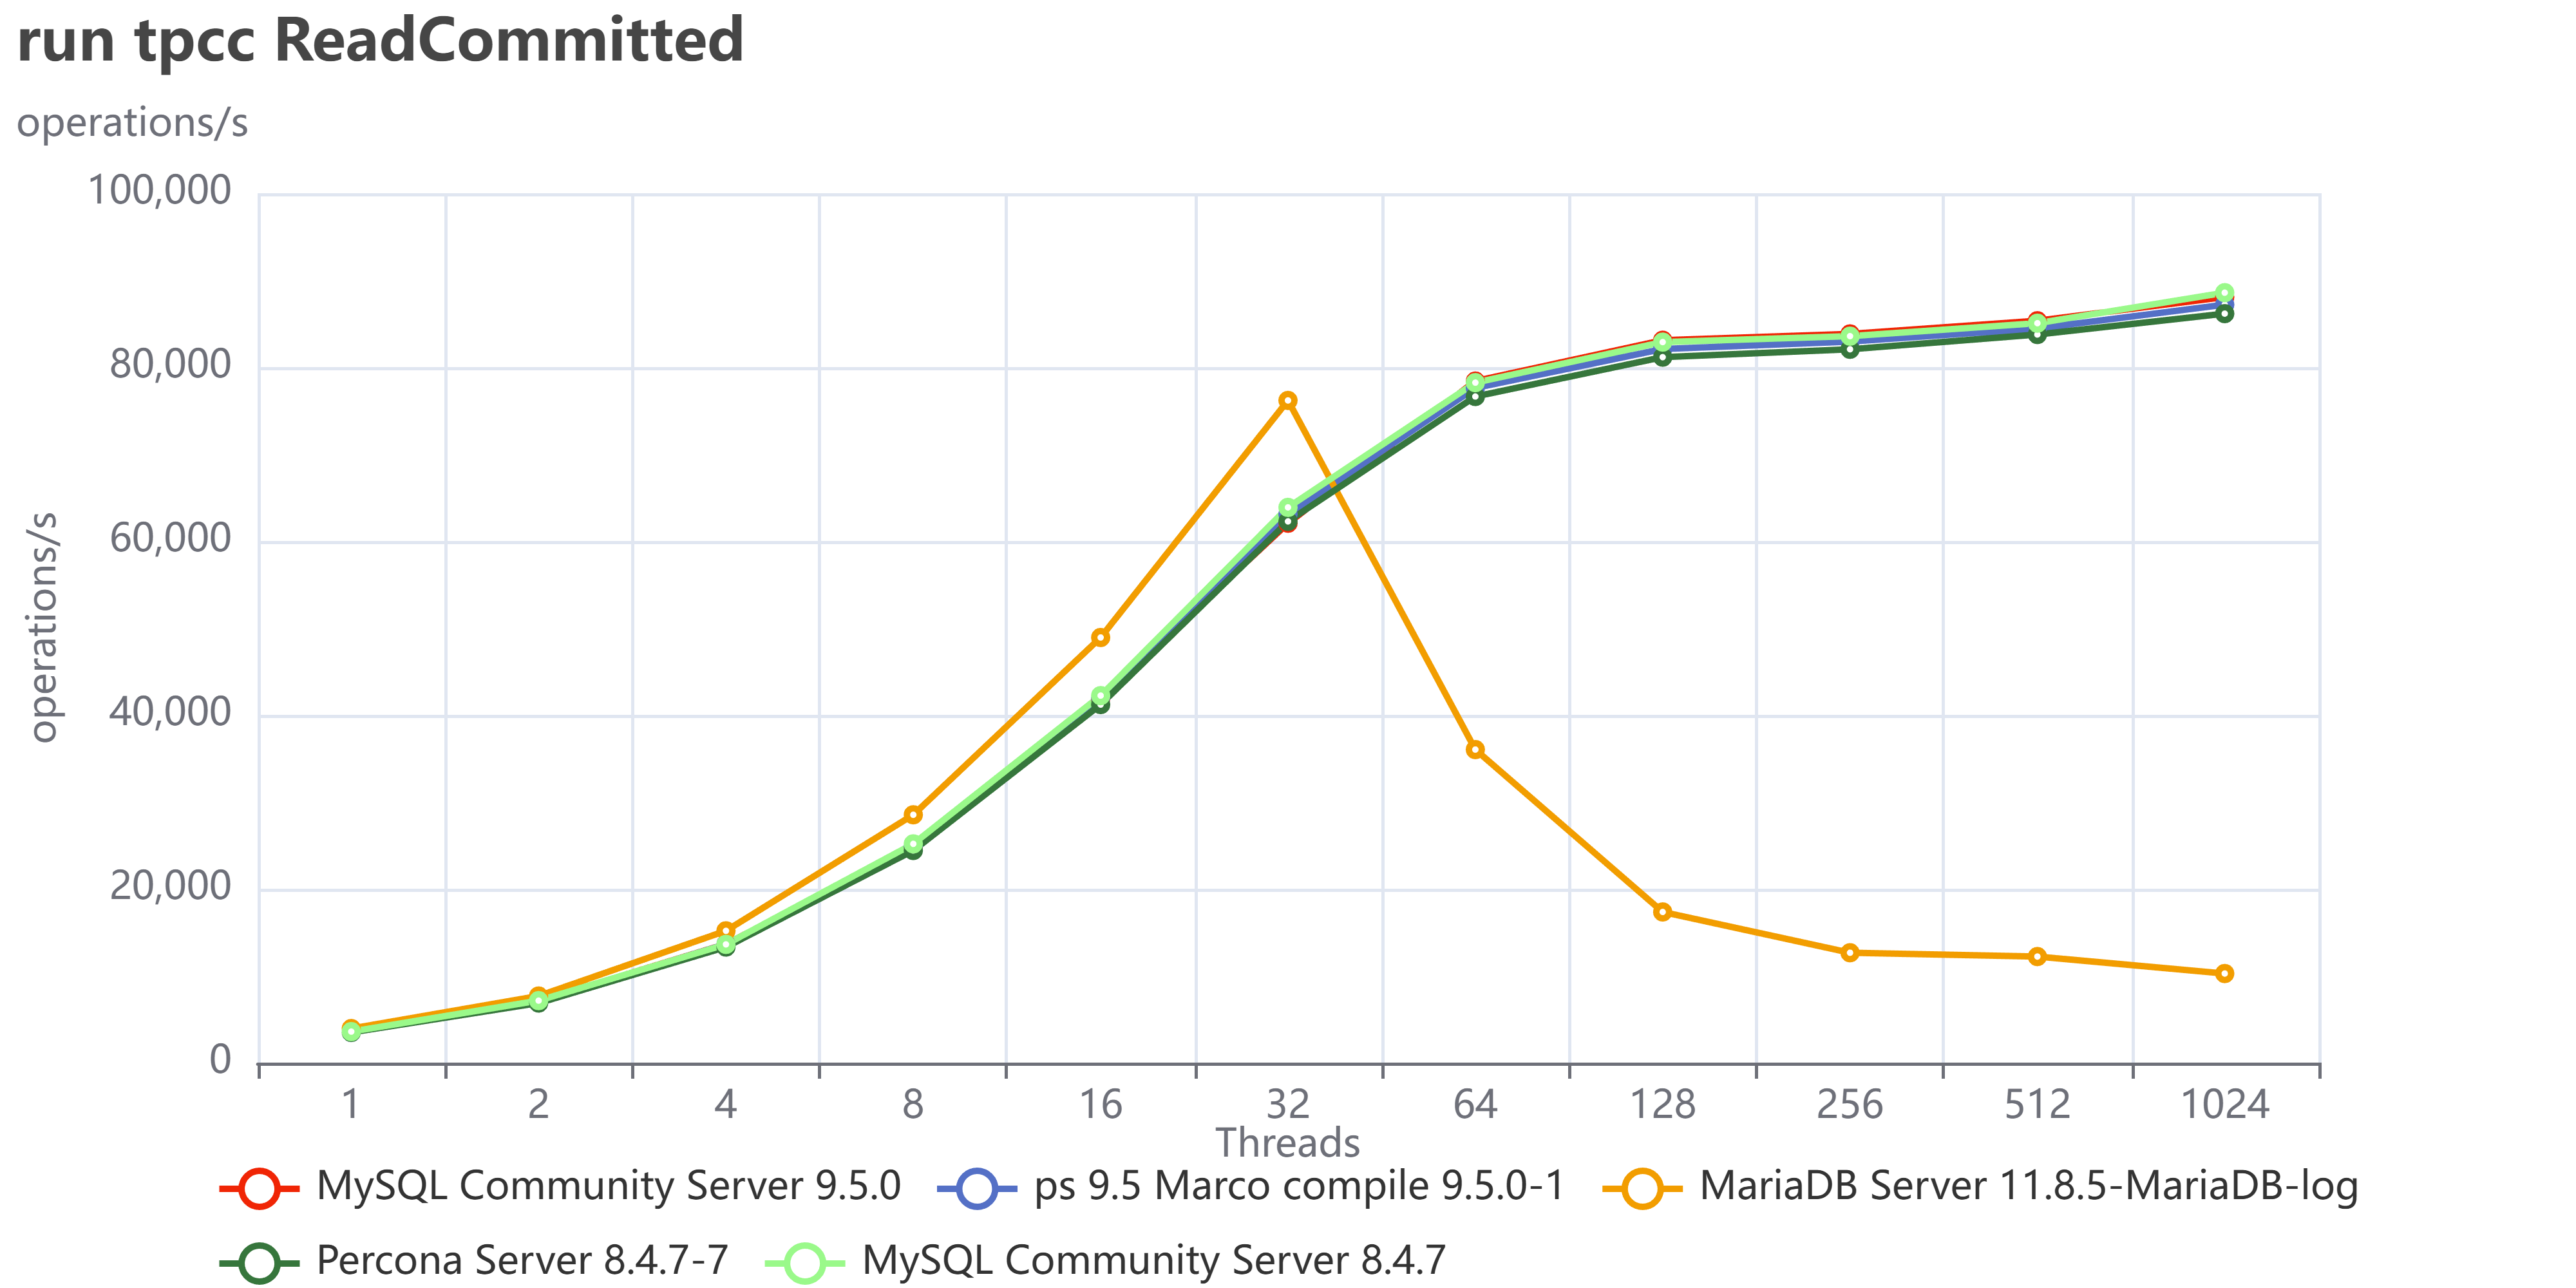
Let us now add MariaDB 11.8.5 and stay focused on MySQL/Percona 8.4 and 9.5

run tpcc RepeatableRead

run tpcc ReadCommitted

This doesn’t look very good, right? What it seems is that MariaDB is doing great up to 32 threads, then just stops and cannot serve traffic. 

Restricting the concurrency to a maximum of 32 threads would have prevented the observation of MariaDB's saturation point, thereby yielding inaccurate test results and erroneous conclusions. This is why I am always first trying to identify the saturation point, then scale the tests.   


Why did we have that? We need to keep in mind that in TPC-C like tests execute a lot of reads and writes 50/50 inside the same transaction and as concurrent operations, better reflecting the reality of what happens on a busy system. 

In any case, I was really puzzled by this MariaDB behavior, which seems very weird to me. So I decided to also run all the sysbench tests I have and see what happens (to see the full results, see this.) 

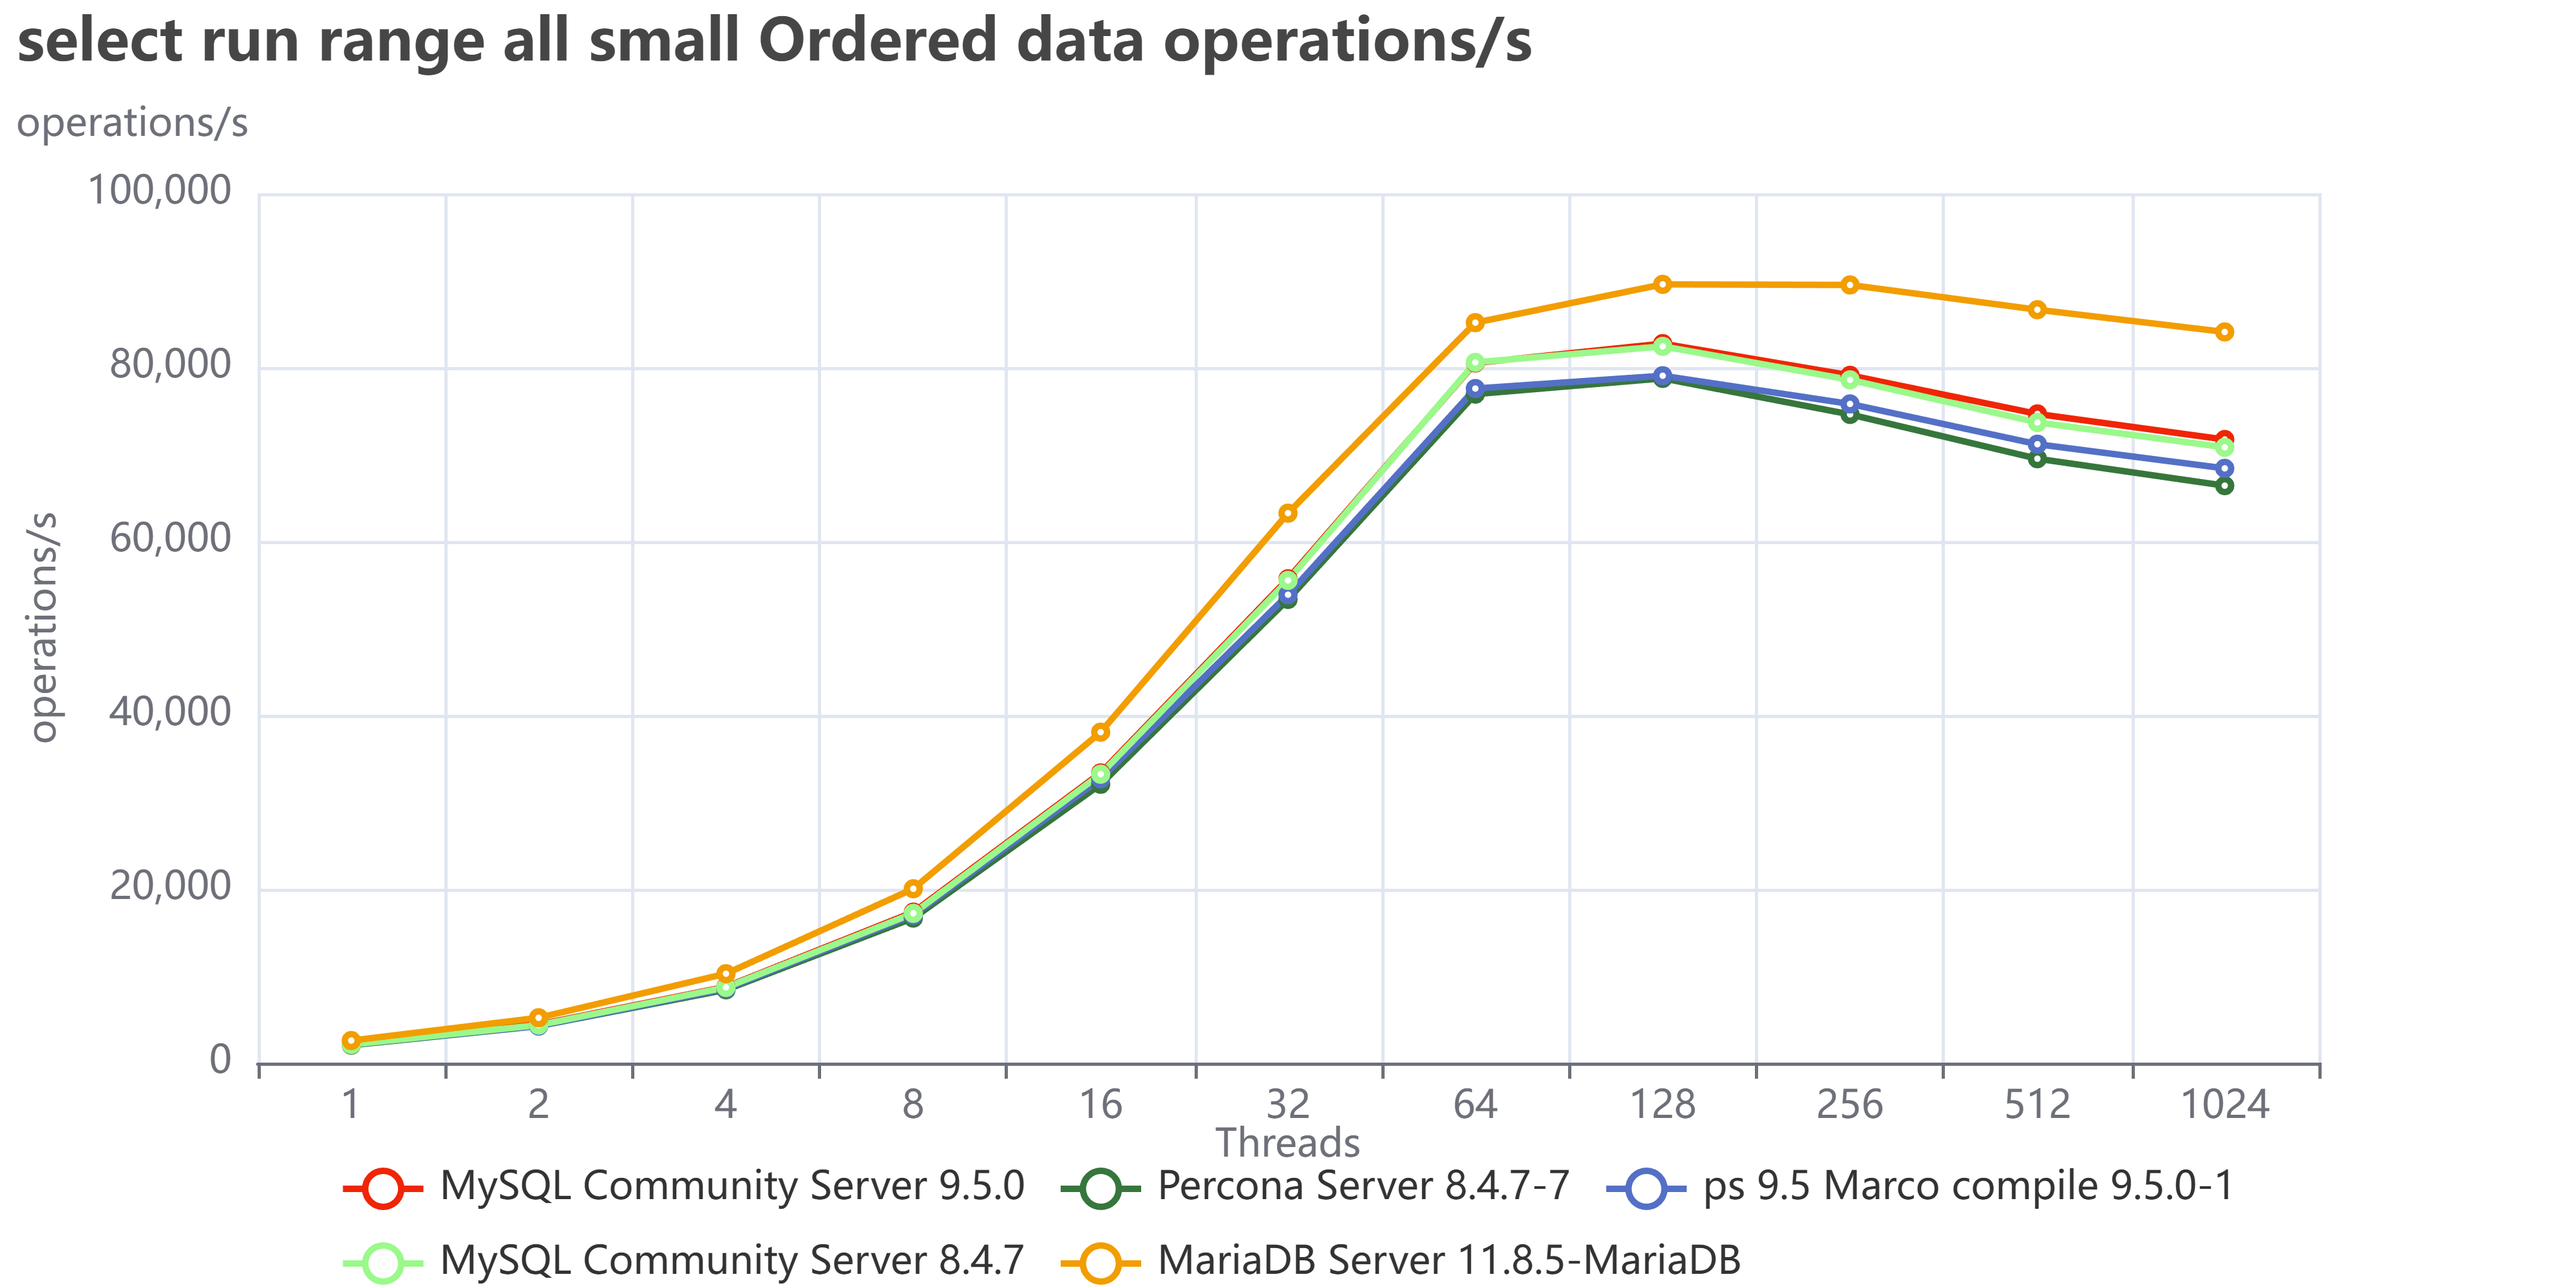
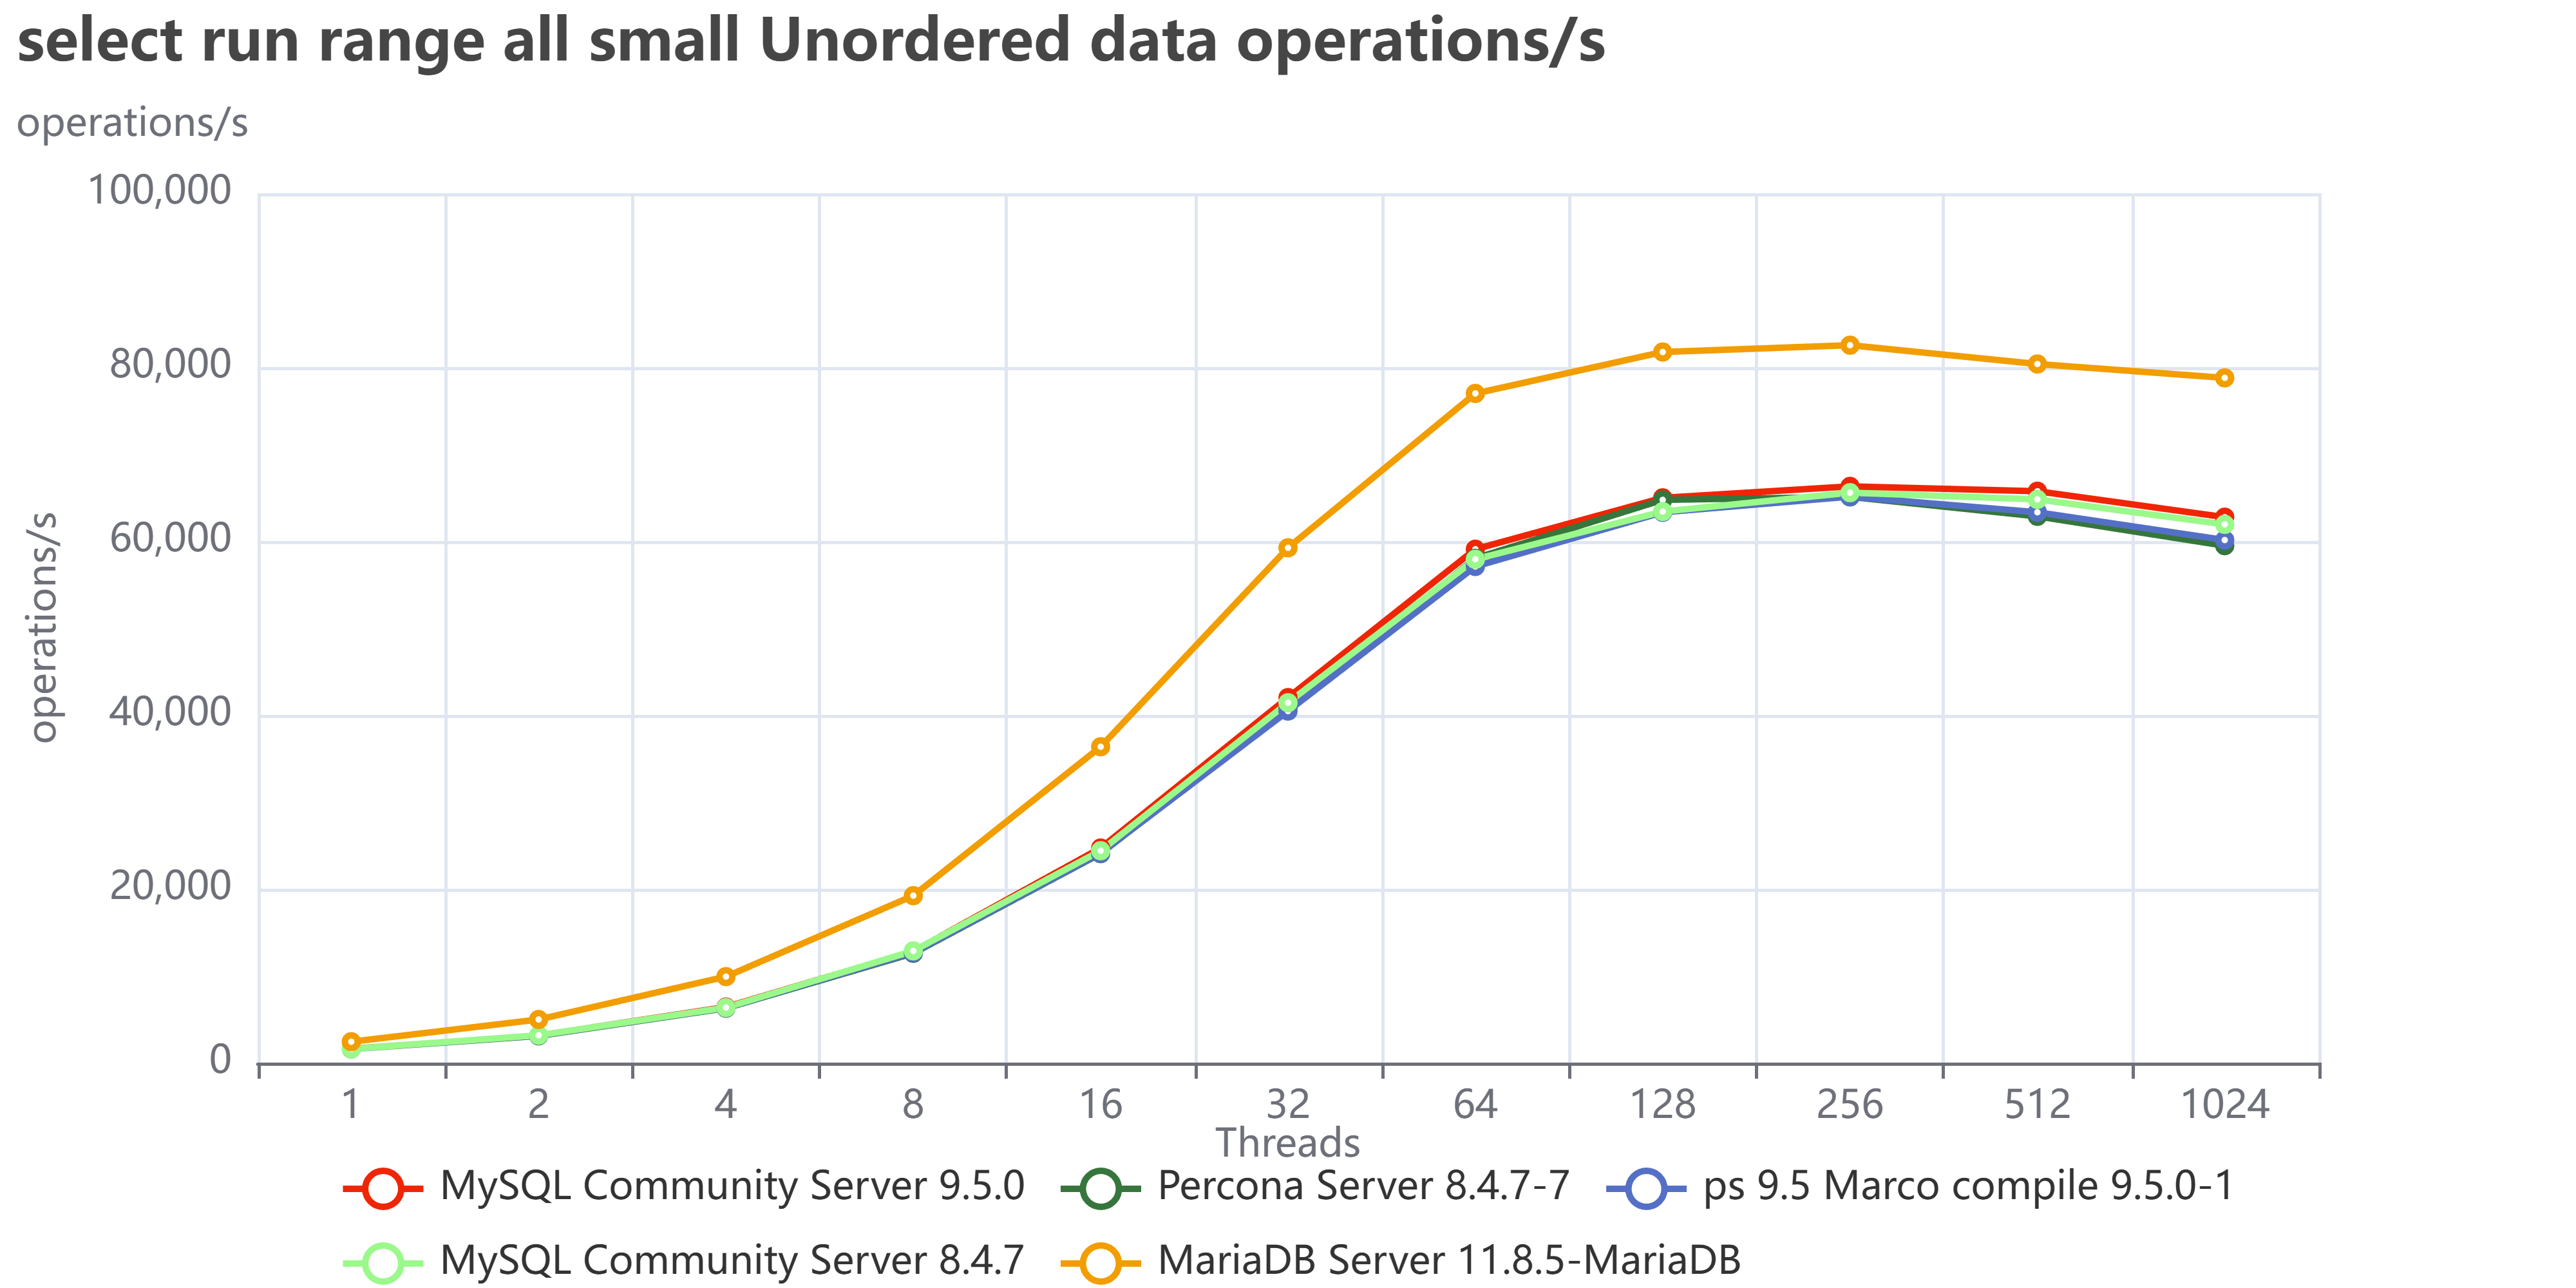
What comes up from this exercise is a different scenario. Executing isolated tests, MariaDB is doing great and often surpassing MySQL or Percona server in reads.
Let us see some examples like the range tests all, where I execute all the range tests:

select run range all small Ordered data operations s

select run range all small Unordered data operations s


As we can see MariaDB is performing great and in the case of unordered pages is less affected than MySQL/Percona. 

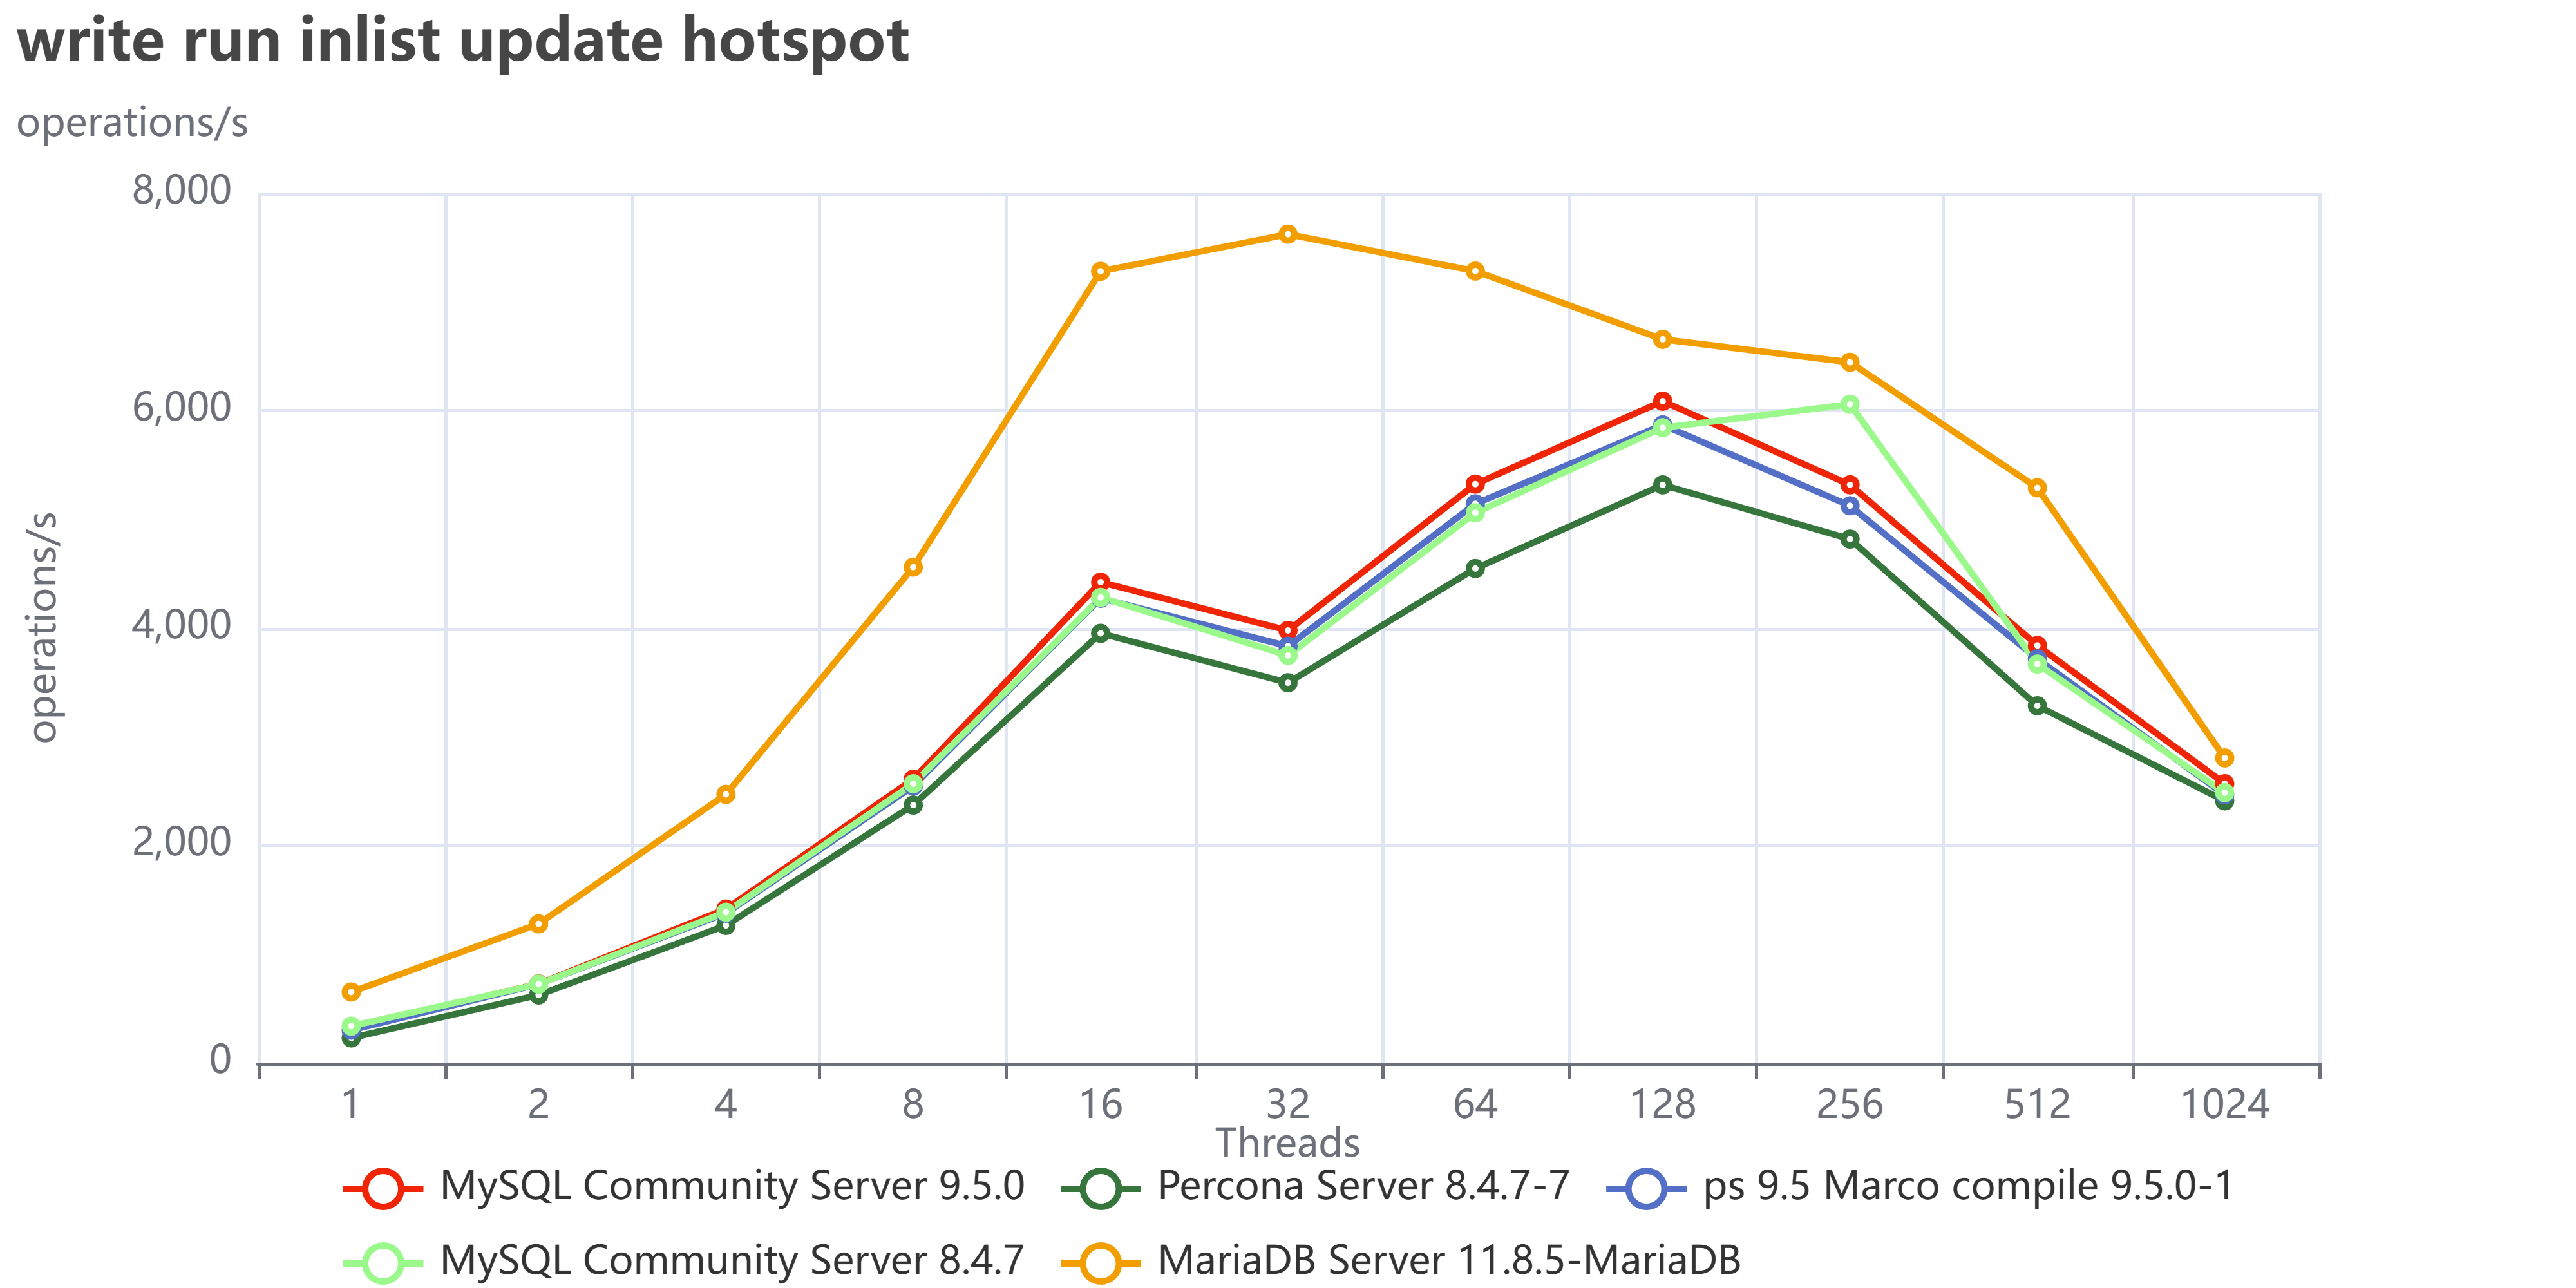
And this is the trend for all reads. What about the writes then?

Well in some cases like when we have in list update with hotspot MariaDB it is still doing good:

write run inlist update hotspot

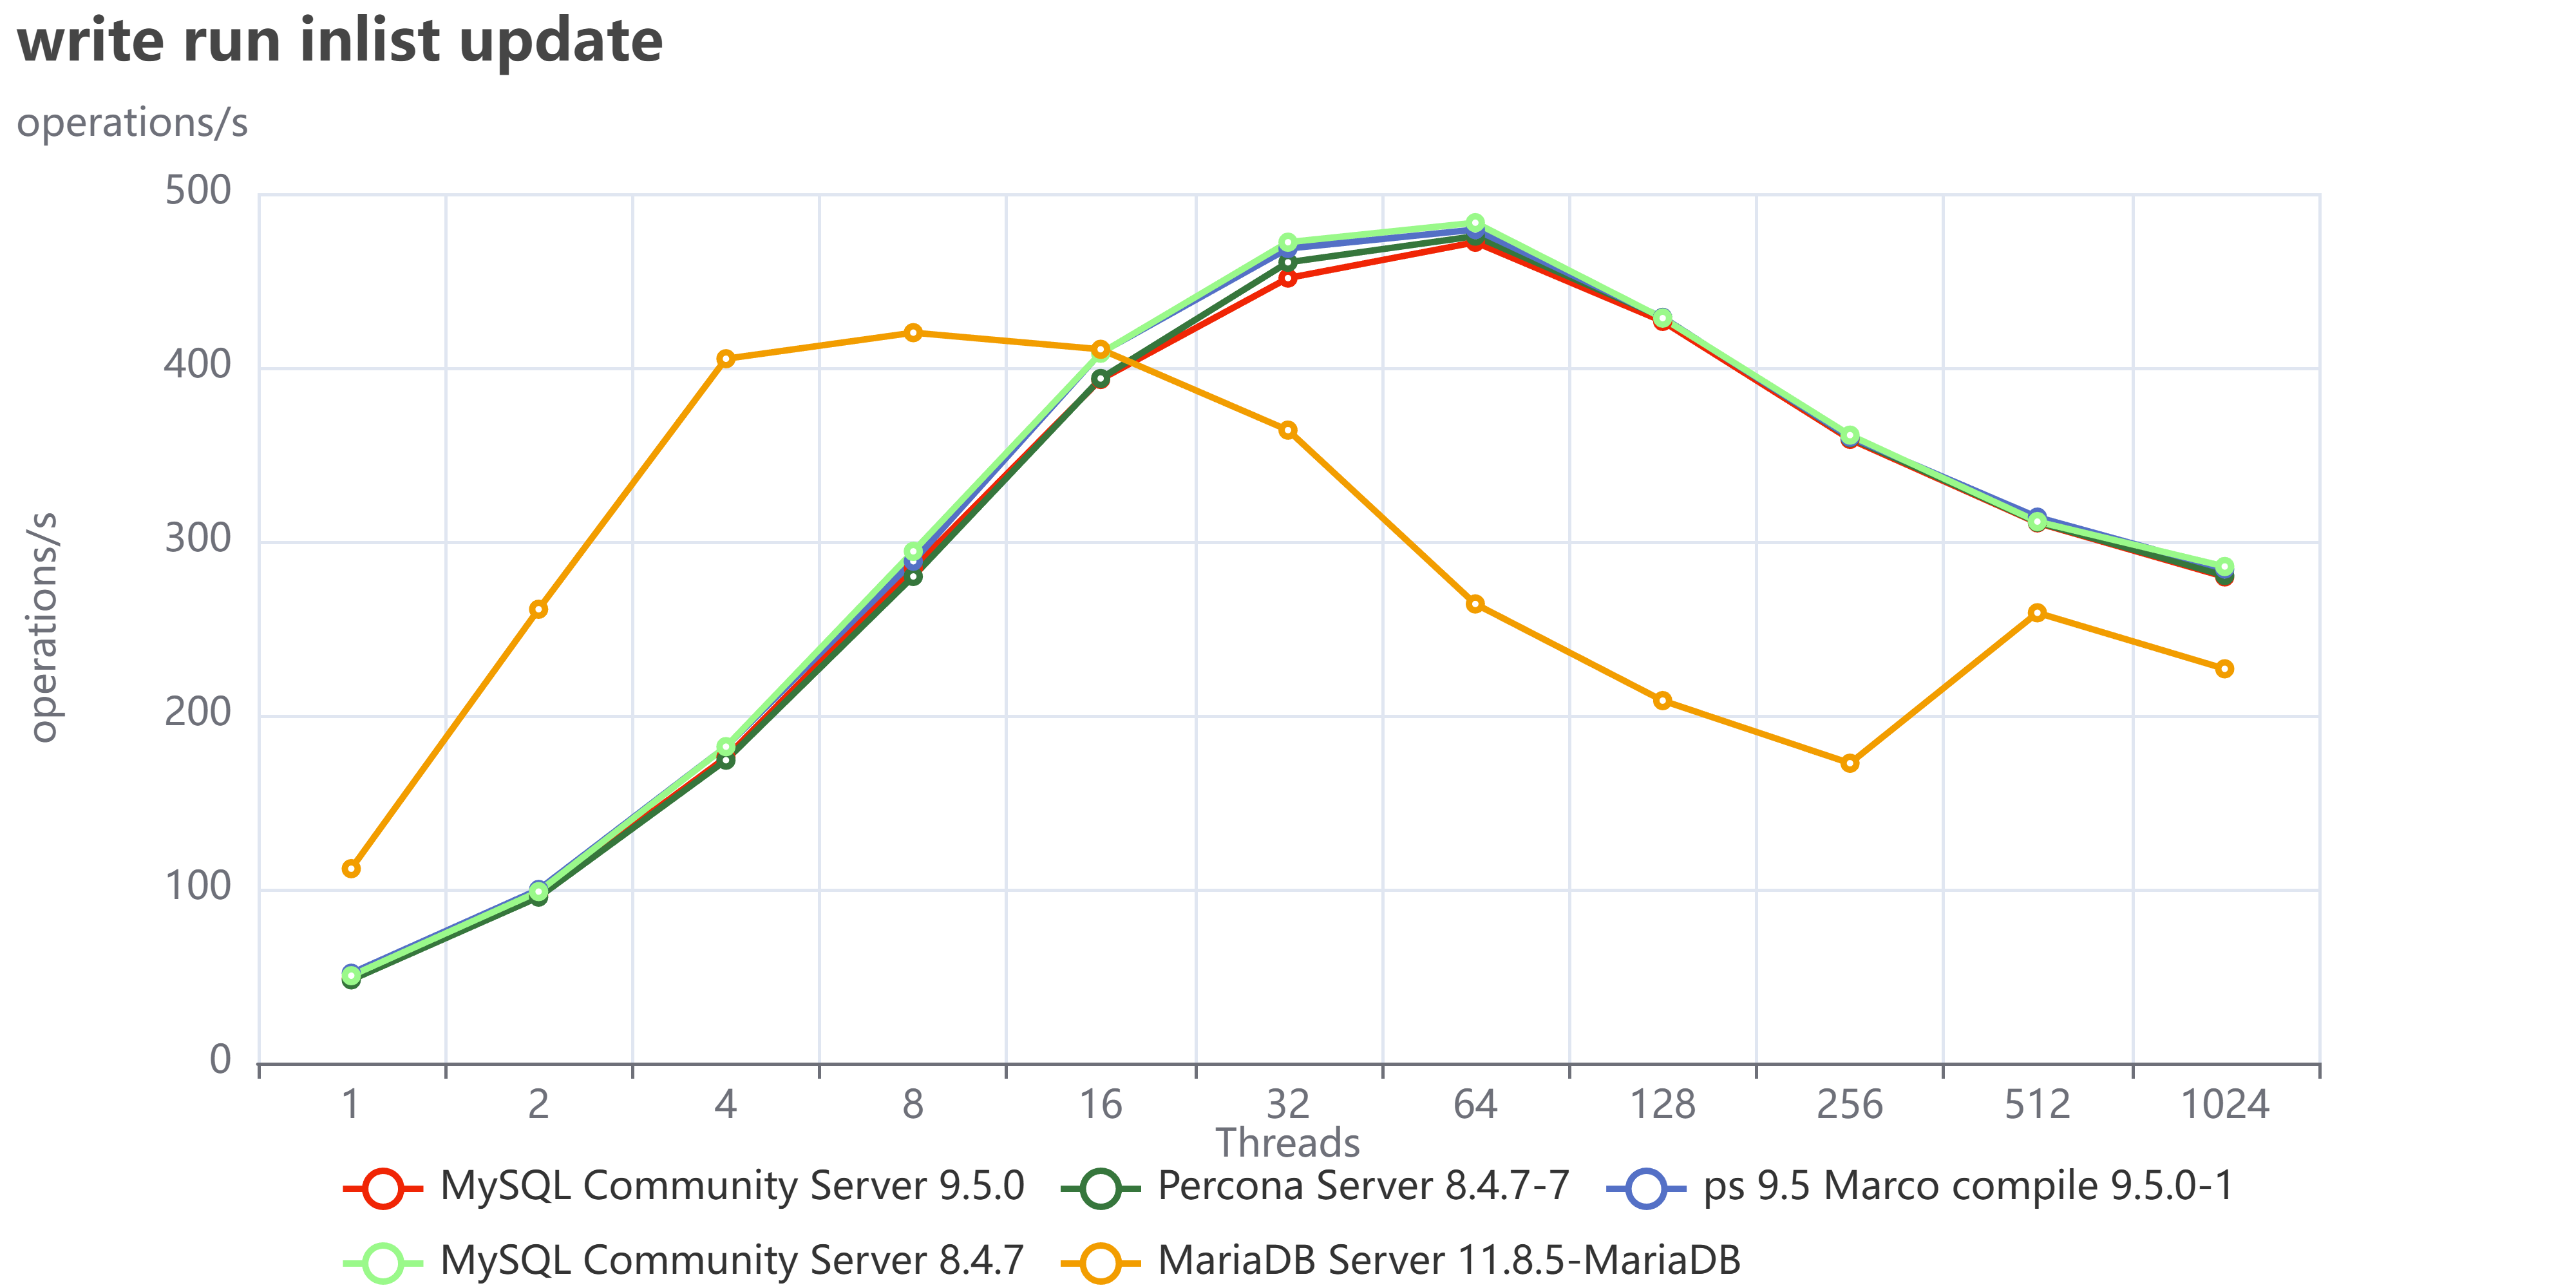
But if we do not have hotspots, when the writes are distributed across the whole dataset:

write run inlist update

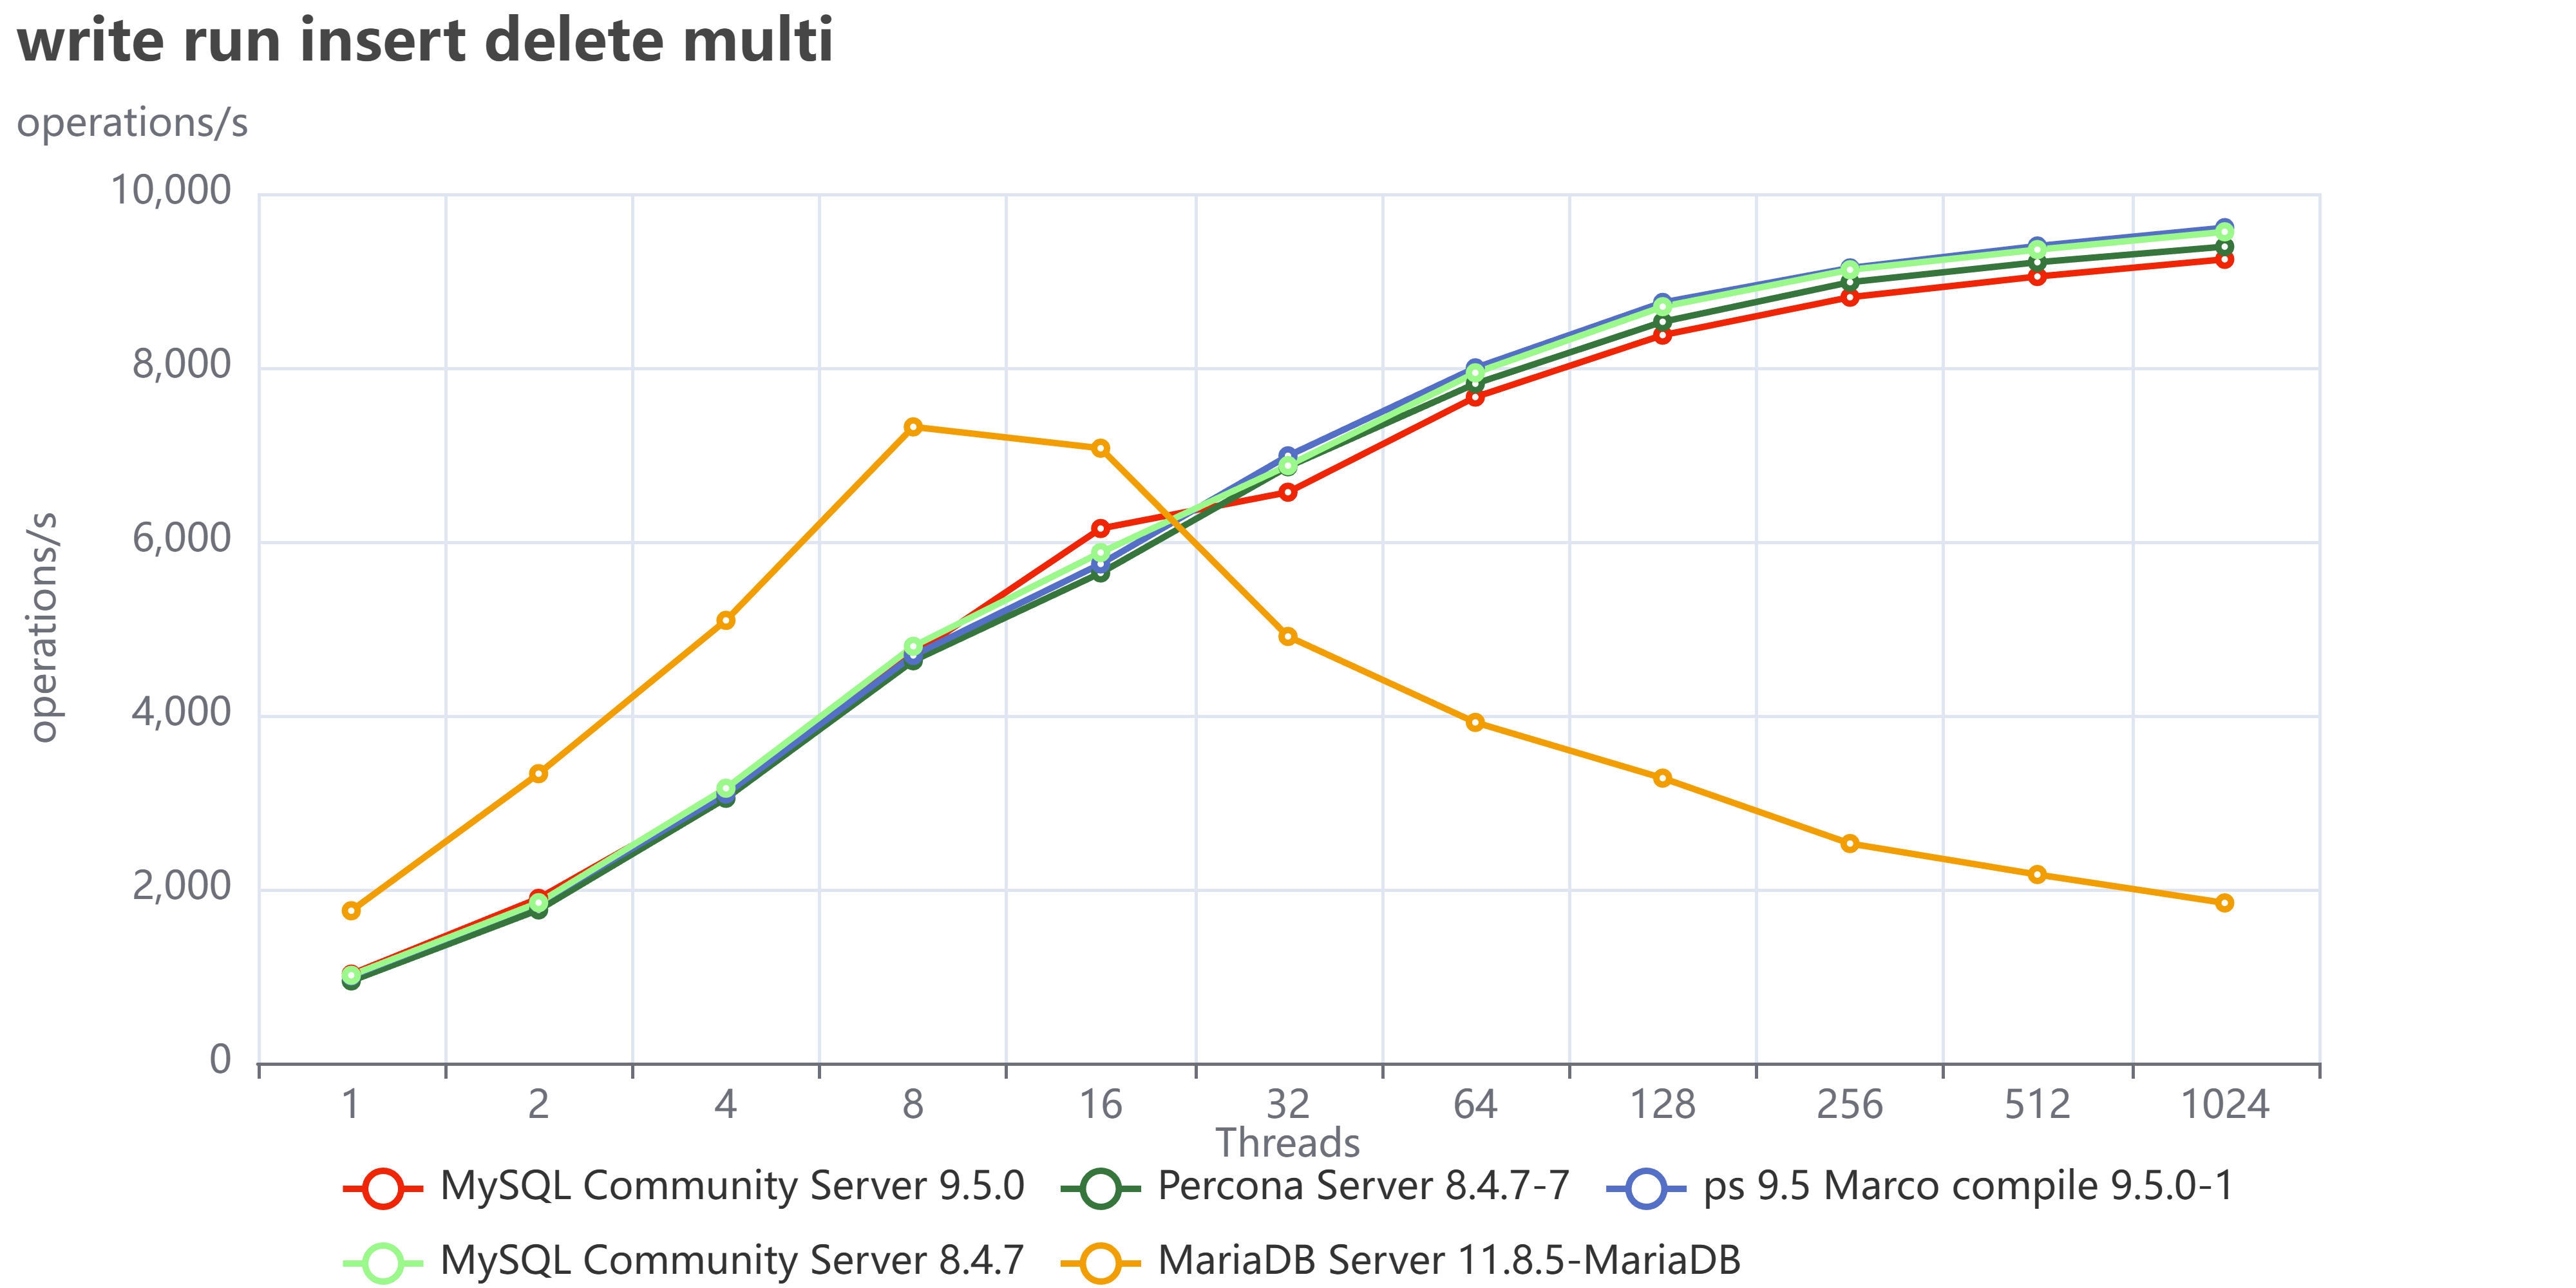
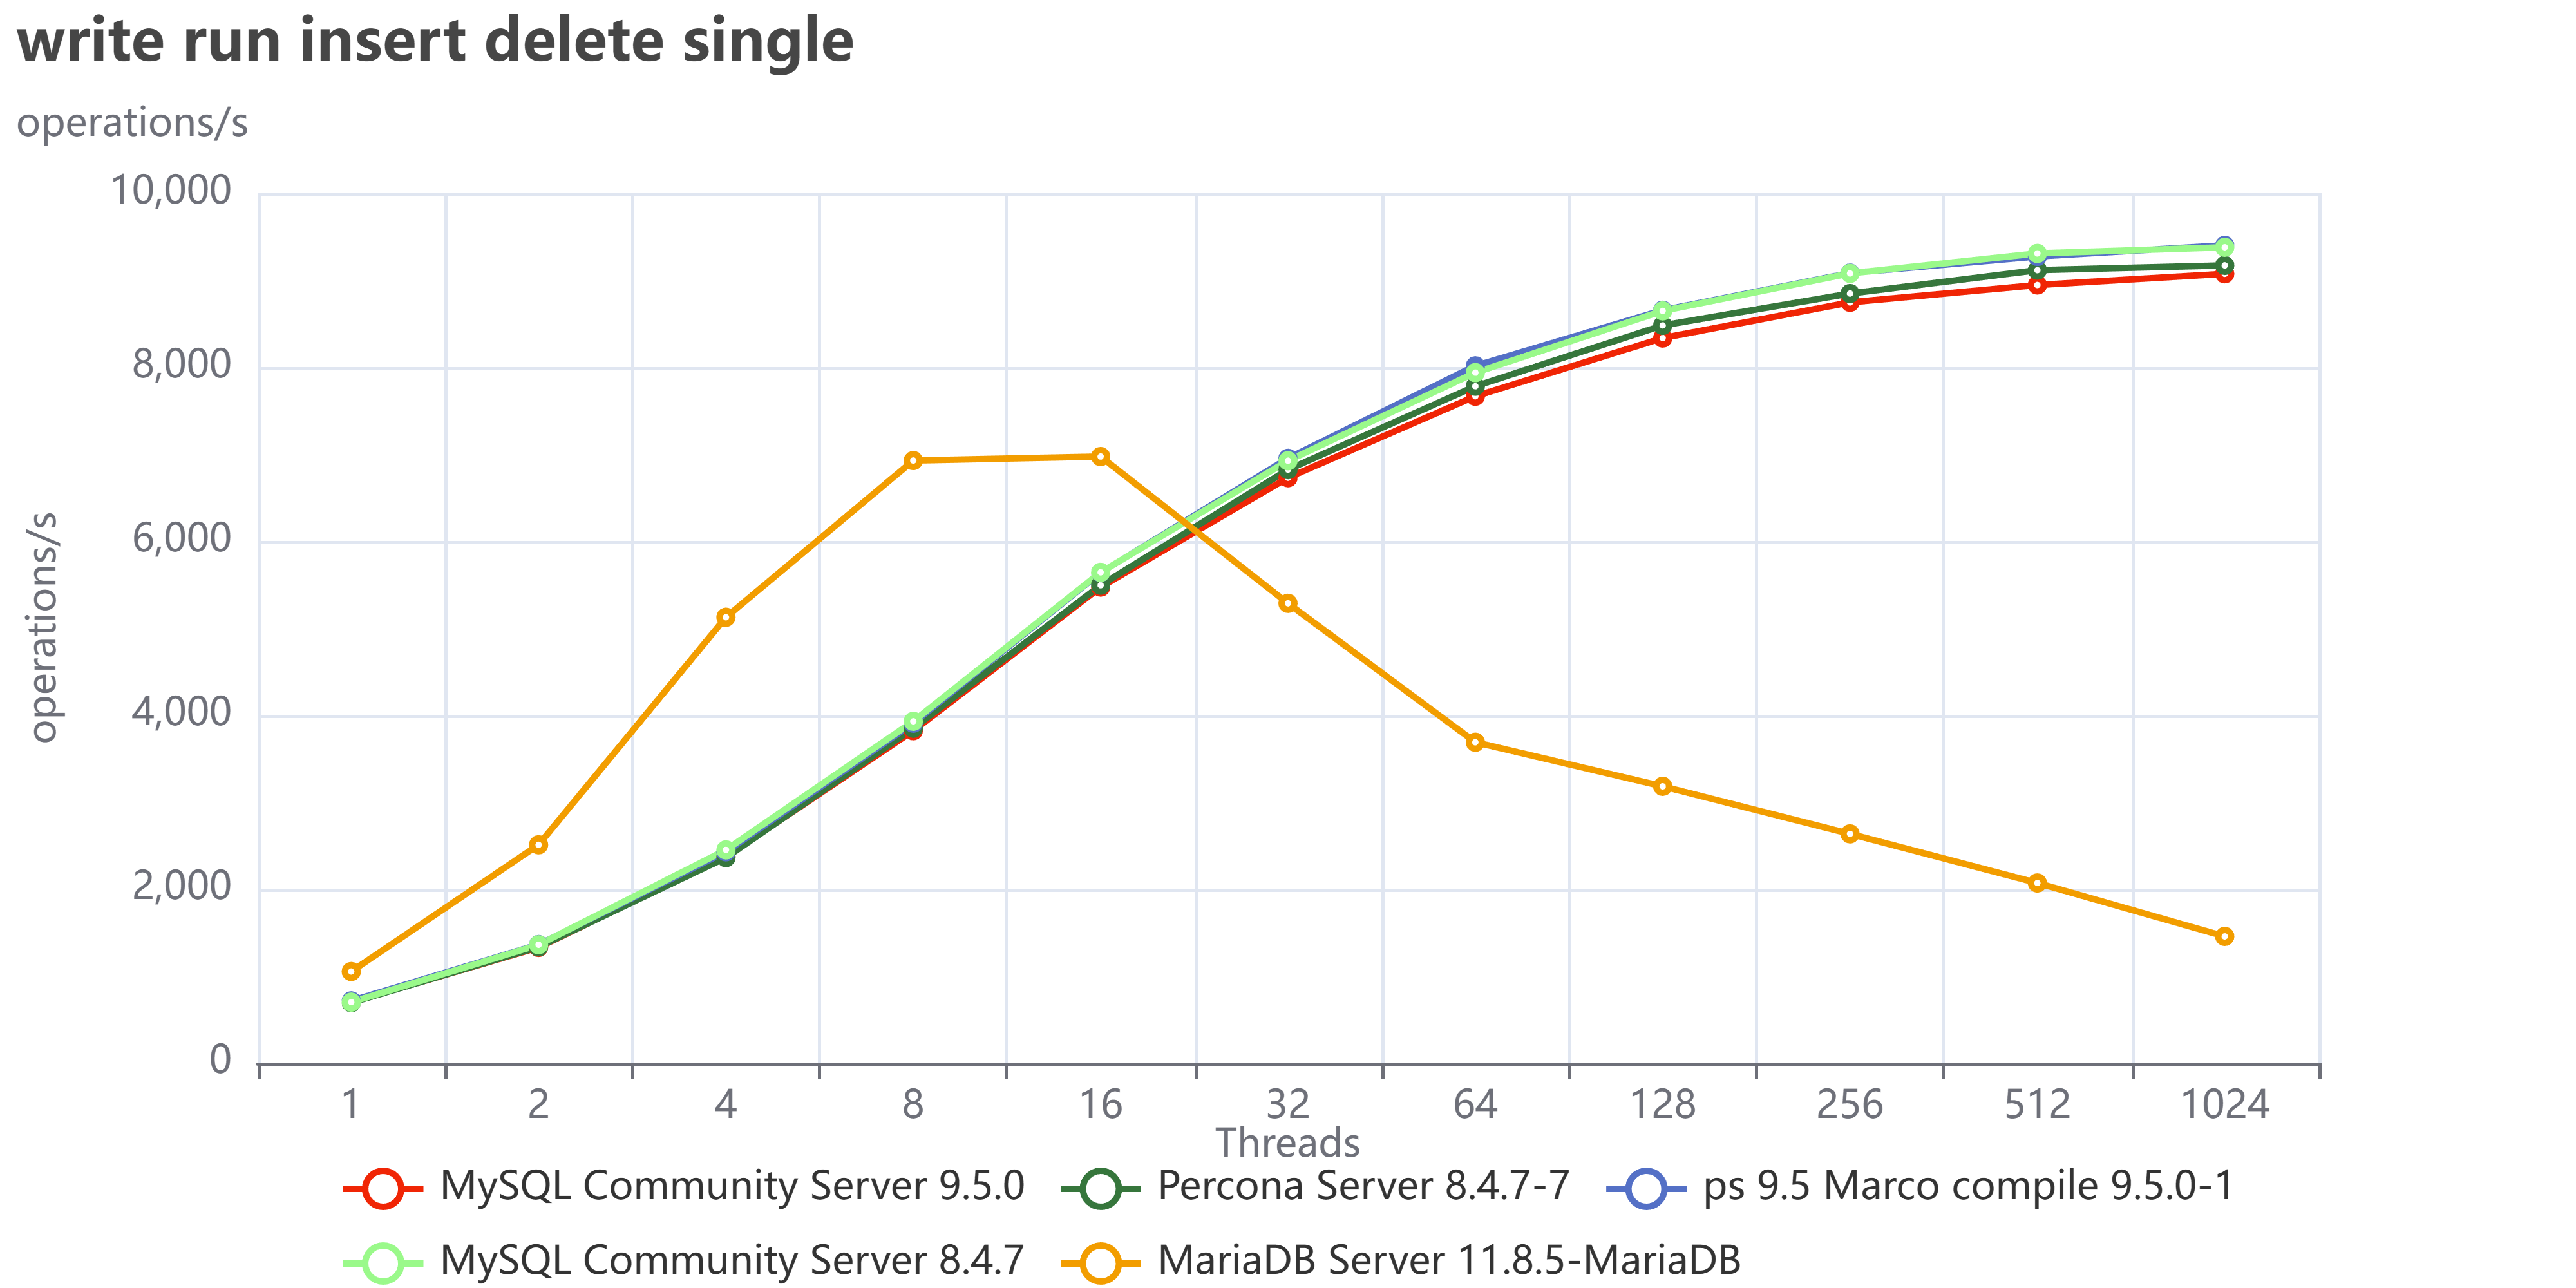
This is even clearer when using insert/delete:

write run insert delete multi

write run insert delete single

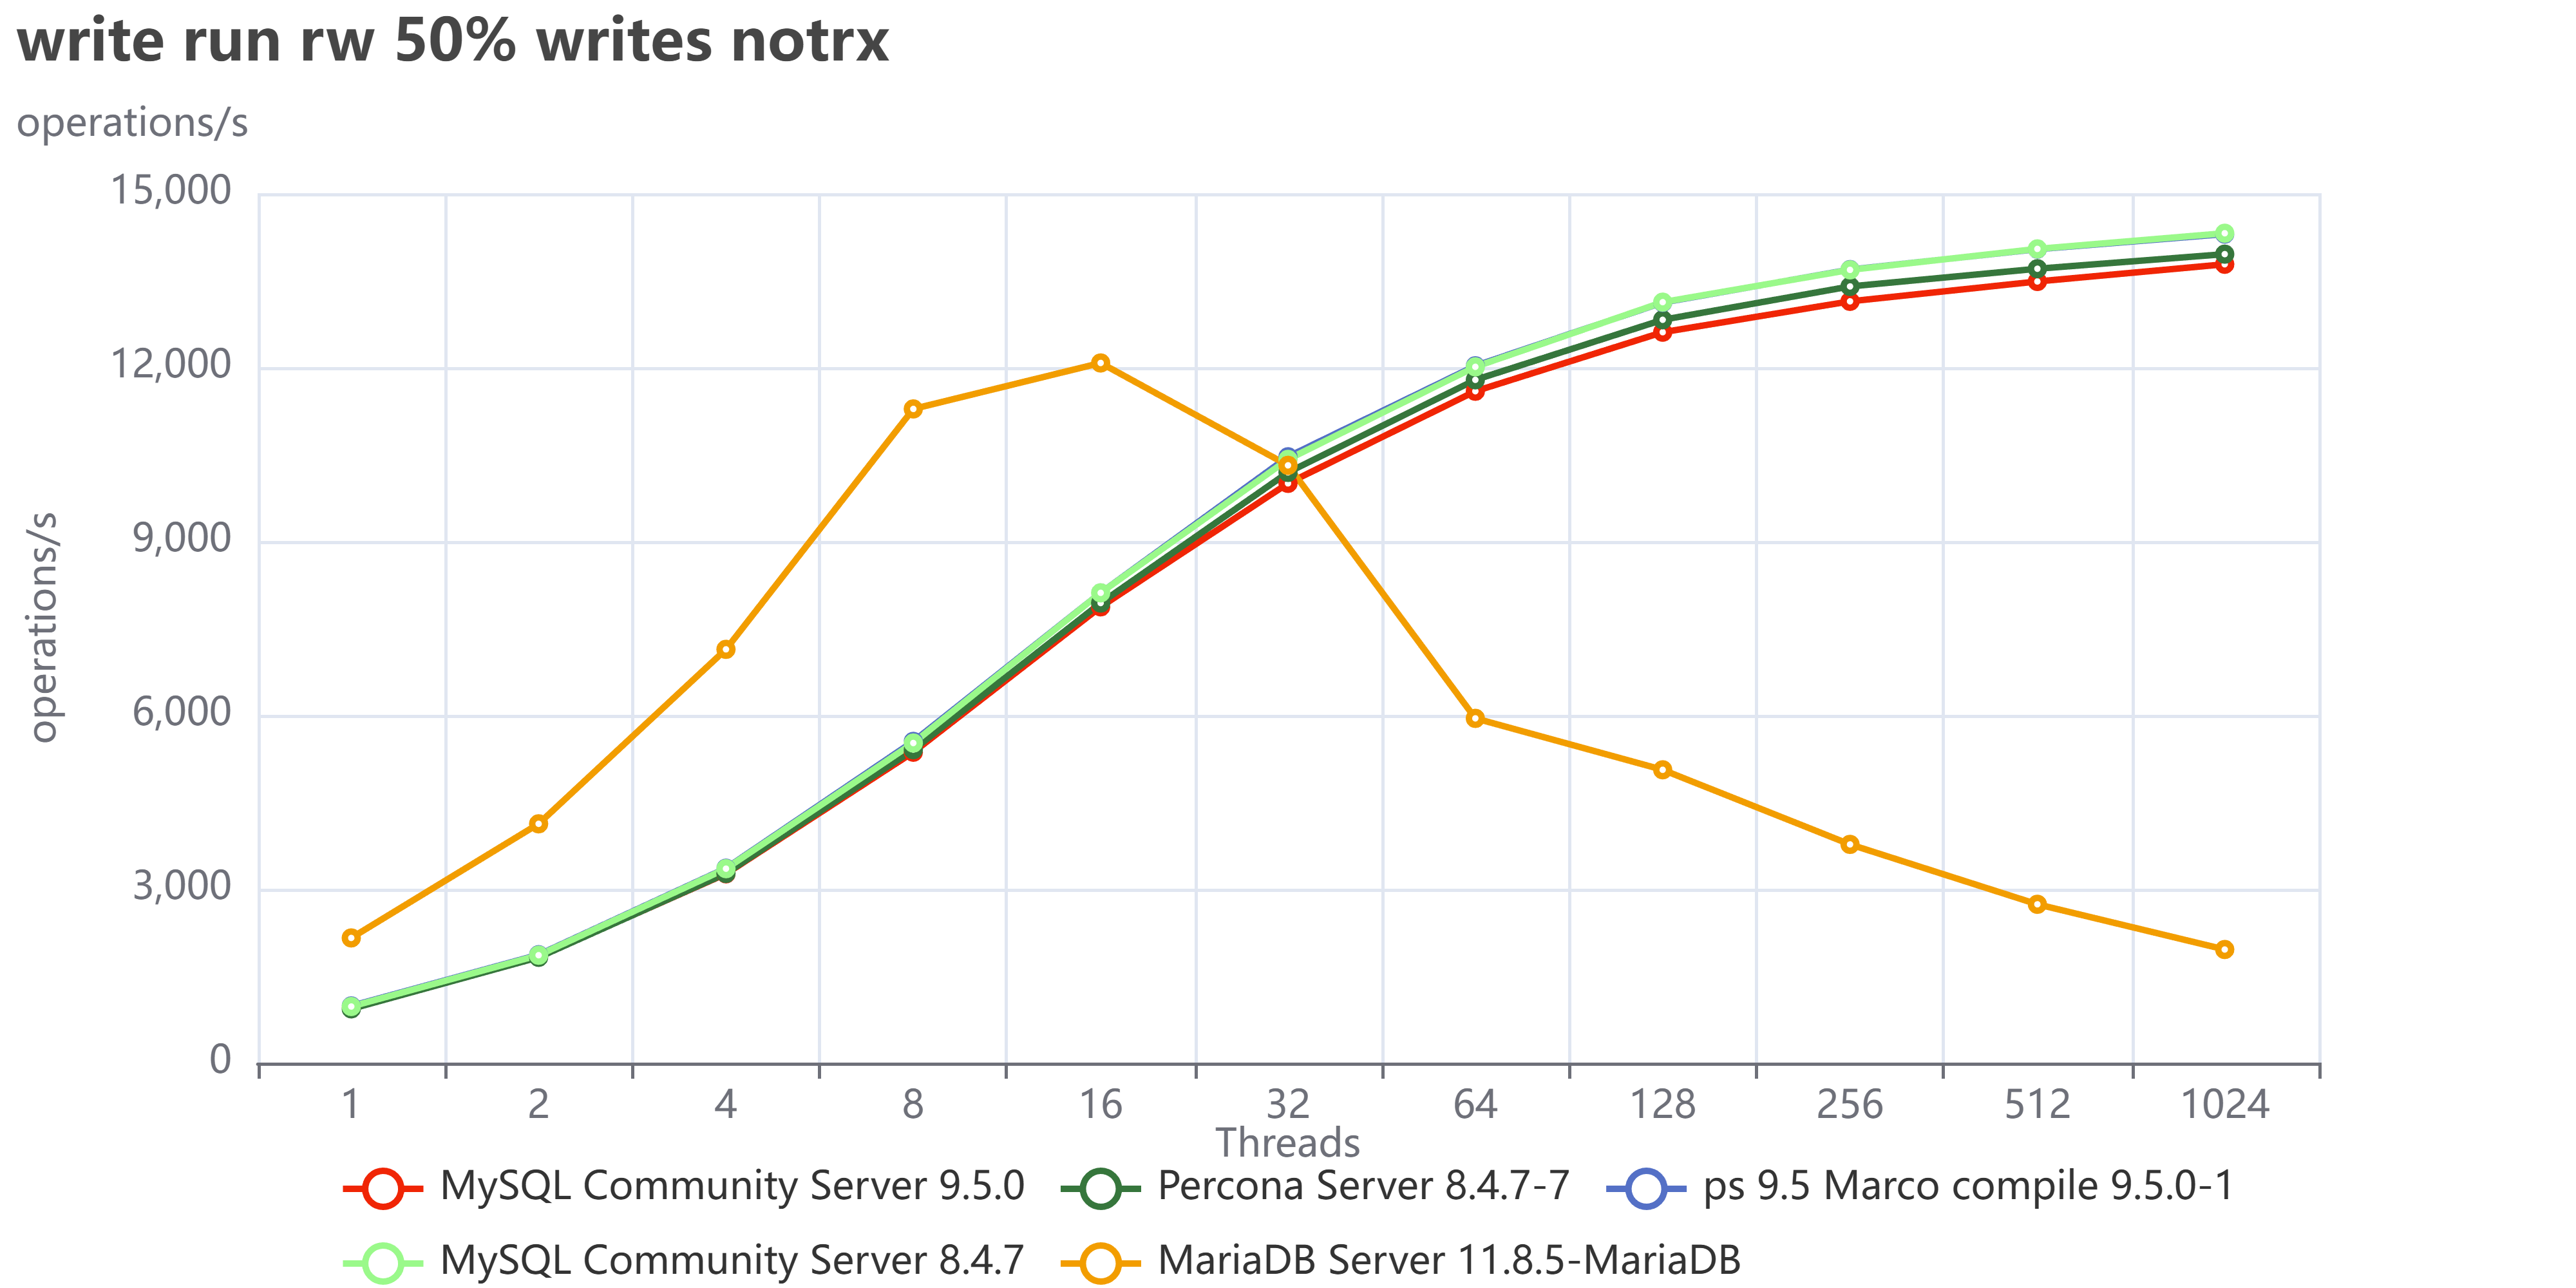
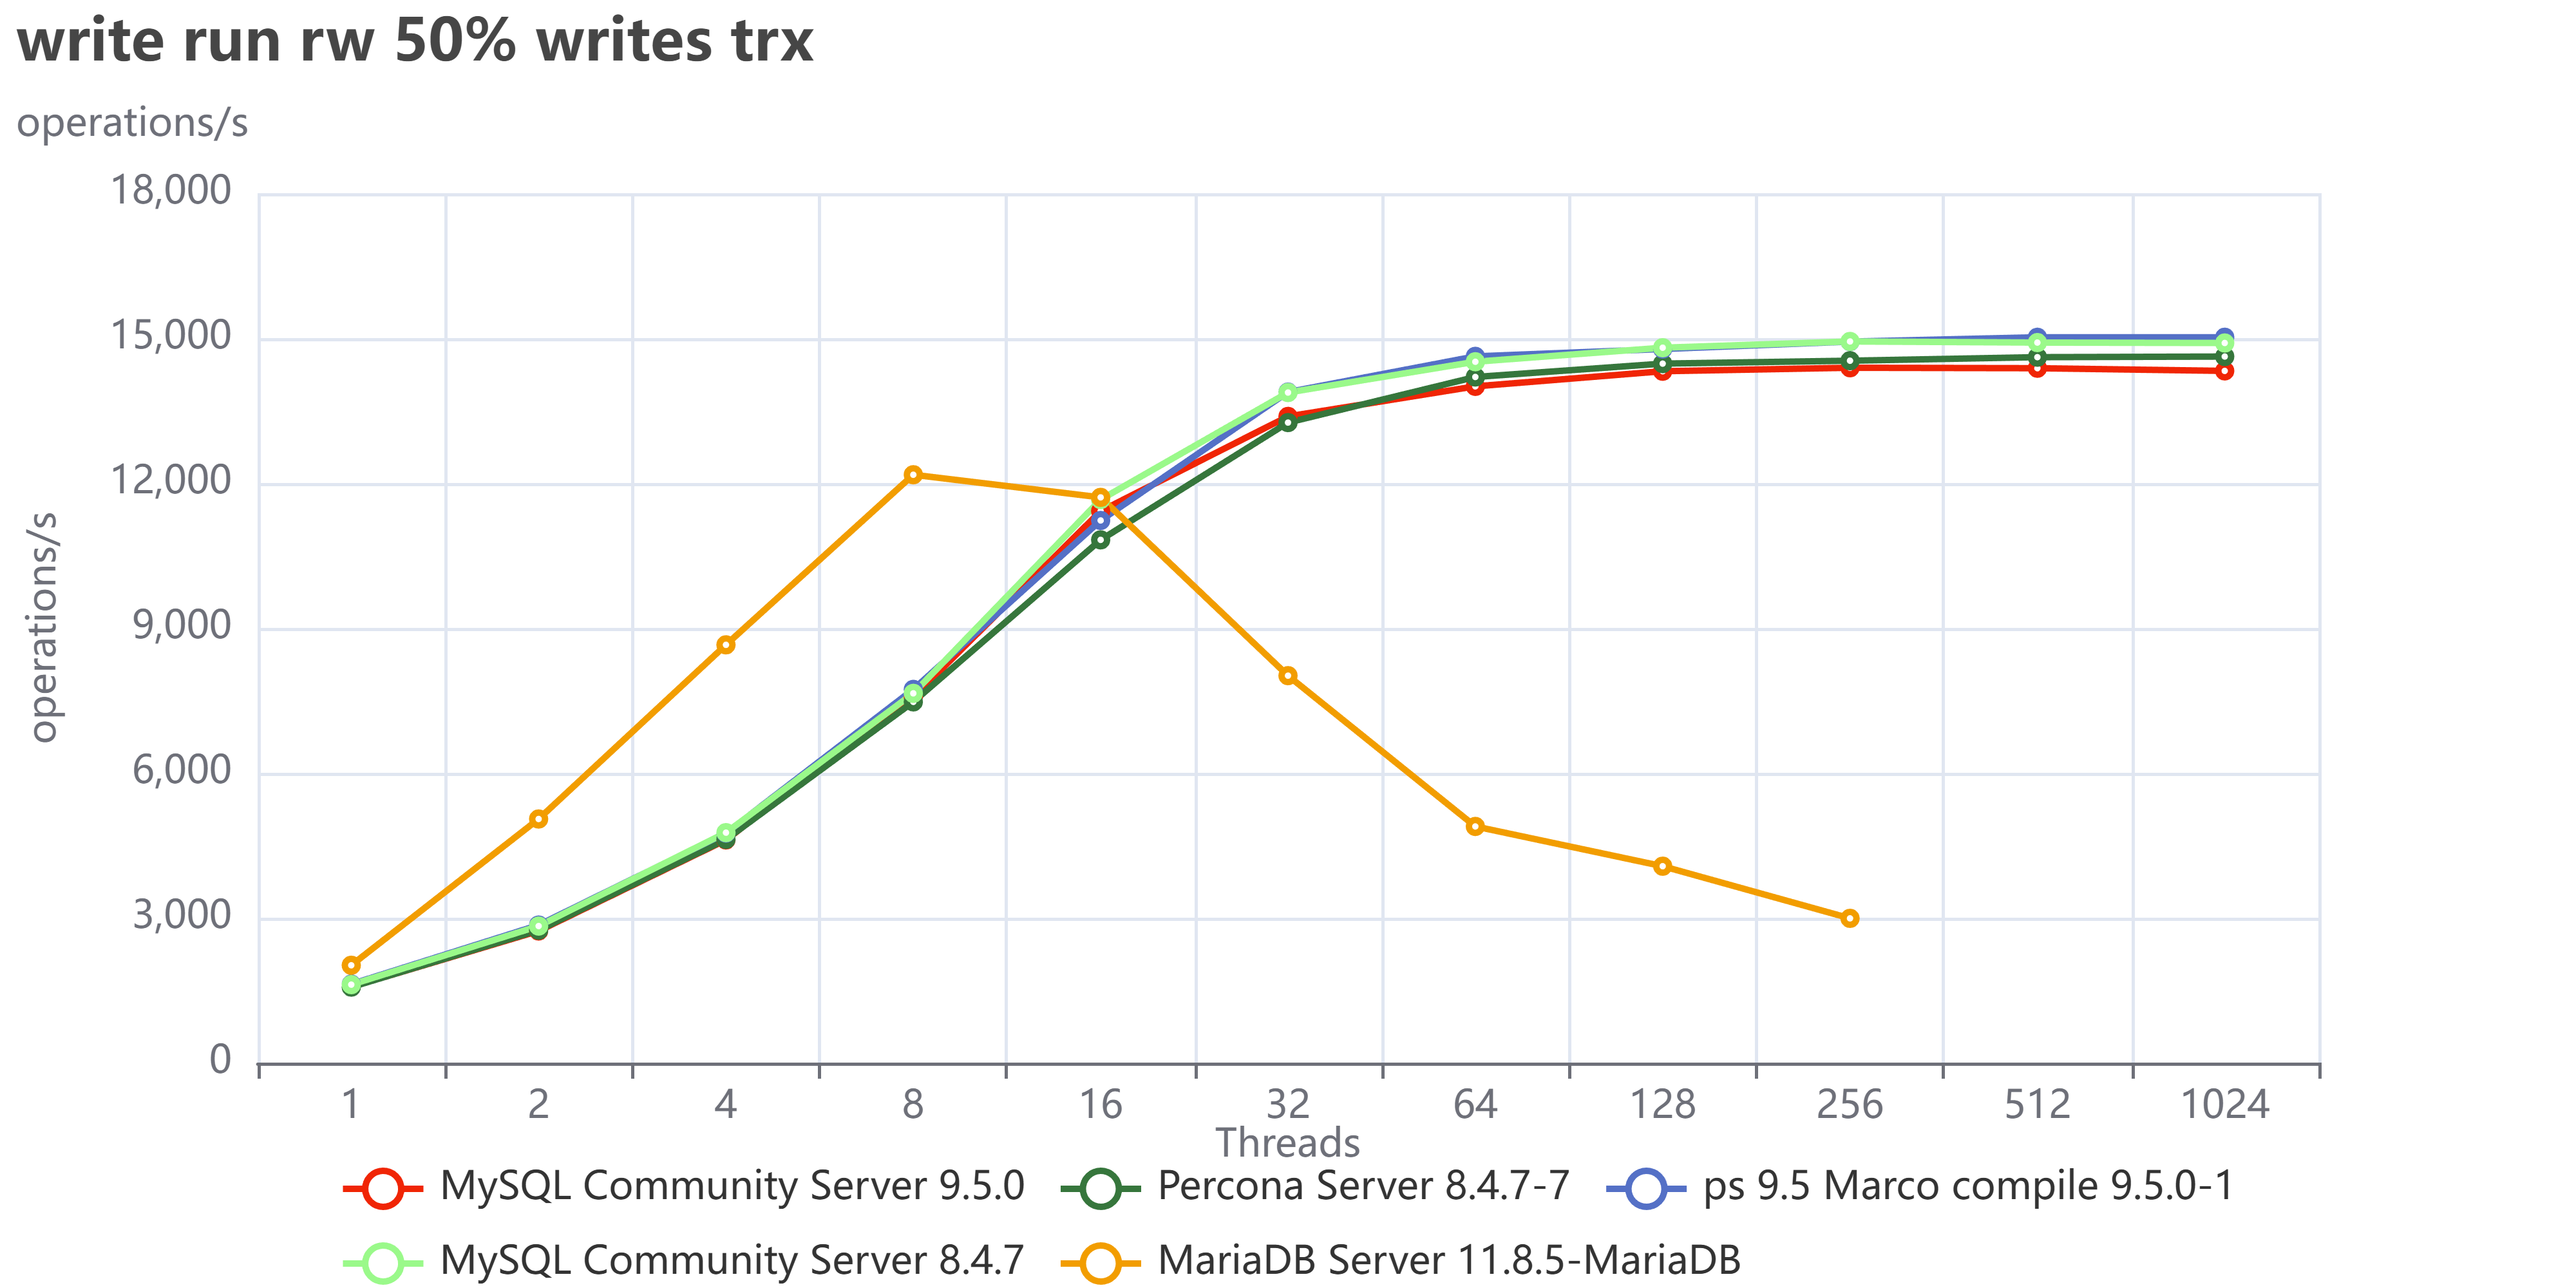
Finally, if we collect the tests that execute read/write operations:

write run rw 50 writes notrx

write run rw 50 writes trx


We can see we have a very similar behavior as we had with TPC-C tests. 

I did not investigate in detail what is causing MariaDB to fail so much in write operations, but my gut tells me to point toward the InnoDB Buffer pool restructuring they had done, which is probably also the reason why MariaDB is doing better in reads. I am obviously open to collaborate with any MariaDB folk that would like to tune and test again, just ping me.

If you want to browse all tests go: here for tpcc

Conclusions

The tests performed using TPC-C like tests confirm that the MySQL debacle should be over. At the same time, they indicate that the race to get better performance is open again, and I am intrigued to see what will come next, hoping we will see Percona sprint again and add a significant performance gain, not only enterprise features.

For now, MySQL/Percona 9.5 confirms to be the better performing MySQL version currently available, for its stability and scalability. 

I also think we should investigate a bit more on MariaDB implementation and identify what is making that solution operating much better in reads and acting so poorly for writes. For sure, we are not in the LAMP era anymore, when the majority of operations were read. Nowadays, the standard load and utilization on a DB sees read/write operations executed with a high level of threads, so a behavior like the one MariaDB has is not acceptable. But I am sure that if they investigate and focus on that, they will be able to identify the bottleneck and fix it.

Finally, I can't wait to see this product become even better. I truly hope that our push for the community to step up and take charge yields the results we're aiming for.


In the meanwhile, have a great MySQL (and MariaDB)!

No comments on “MySQL January 2026 Performance review”

How to Set Up the Development Environment for MySQL Shell Plugins for Python

Details
Super User
MySQL
27 February 2025

MySQL Shell is a powerful tool for managing MySQL databases, and one of its most exciting features is the ability to extend its functionality using plugins. If you're a Python developer, you can create custom plugins to automate tasks, add new commands, ordolphin programming
integrate MySQL Shell with other tools. However debugging the python code could be cumbersome for mysql-shell given the python code requires some specific objects available only when running inside the shell. 

In this blog post, we'll walk you through the steps to set up your development environment for creating MySQL Shell plugins in Python while able to modify and debug the mysql-shell itself.

Prerequisites

Before we dive into the setup, ensure you have the following installed on your system:


  • MySQL Shell: Download and install MySQL Shell from the official MySQL website.
  • Python 3.8 or later: MySQL Shell plugins require Python 3.8+. You can download Python from python.org.
  • A code editor: Use your favorite code editor, such as VS Code
  • Git: Optional, but useful for version control.


A directory structure as follow:

mysql_source/
├── boost
├── mysql-8.4.4  <-- directory where we compile the mysql server 
├── mysql-server <-- directory with the source code (from git or package)
├── mysql-shell  <-- directory with the mysql-shell code from git
├── mysql-shell-build-vs <-- directory where we build using Visual Studio
└── mysql-shell-plugins  <-- directory with the example plugin 


Step 1: Collect and compile MySQL server code

If you want to clone the MySQL repository:

git clone https://github.com/mysql/mysql-server.git

git fetch

git checkout tags/mysql-8.4.4 -b mysql-8.4.4 


Or just download the source code from the website for that specific release:

curl https://dev.mysql.com/get/Downloads/MySQL-8.4/mysql-8.4.4.tar.gz - o mysql-8.4.4.tar.gz


In both cases once you have the code locally we need to configure and build the libraries.

For more information about how to compile and dependencies check here


Then we go inside the compile directory (mysql-8.4.4) and configure it:

cmake /<path>/mysql_source/mysql-server -DCMAKE_INSTALL_PREFIX=/<path>/mysql_templates/mysql-8.4.4 -DWITH_DEBUG=1 -Dprotobuf_BUILD_SHARED_LIBS=ON


And we compile the needed libraries:

  cmake --build . --target mysqlclient

  cmake --build . --target mysqlxclient


There is no need to compile the whole server, unless you really want to. 


Step 2: Collect and compile MySQL Shell code

Once the server libs are prepared then go for mysql-shell.

Get the code:

git clone https://github.com/mysql/mysql-server.git

git fetch

git checkout tags/8.4.4 -b 8.4.4


Now my advice is to always do a compilation outside the code editor to be sure we have all the needed components, for more info check here


To configure:

cmake /<path>/mysql_source/mysql-shell -DMYSQL_SOURCE_DIR=/<path>/mysql_source/mysql-server/ -DMYSQL_BUILD_DIR=/<path>/mysql_source/mysql-8.4.4 -DHAVE_PYTHON=1 -DHAVE_V8=0 -DWITH_TESTS=1 -DCMAKE_BUILD_TYPE=Debug -DCMAKE_INSTALL_PREFIX=/<path>/mysql_source/mysql_shell_bin 


If all went well you can check if the mysql-shell works properly running it from the destination path (in the example) /opt/mysql_source/mysql_shell_bin/bin/mysqlsh 

Step 3: Set Up a Python Virtual Environment

To avoid conflicts with other Python projects, it's a good idea to create a virtual environment for your MySQL Shell plugin development.

Open your terminal and navigate to your project directory.

Create a virtual environment:

python -m venv mysqlsh-plugin-env

Activate the virtual environment:


On macOS/Linux:

source mysqlsh-plugin-env/bin/activate


Verify that the virtual environment is active. Your terminal prompt should now show the name of the virtual environment.


Step 4: For lazy people (as myself) download and use existing plugin demos.

Our dear friend Lefred has built a very nice suite that I normally use as a starting point.

Get the code, go to your mysql_source directory and:

git clone https://github.com/lefred/mysqlshell-plugins.git 


In mysql-shell at the moment you can load the plugin at startup only if they are located in the sub-directory ~/.mysqlsh/plugins or where the lib/mysqlsh/plugins is located. See FR here for a more convenient way to dynamically pass the path to browse. 

Anyhow for now and the purpose of this blog let us use a a trick and create a symlink:

mkdir ~/.mysqlsh/plugins

ln -s <path>/mysql_source/mysql-shell-plugins/demo ~/.mysqlshell/plugins/demo


Ok now our code side is set. 

Download and configure VisualStudio.

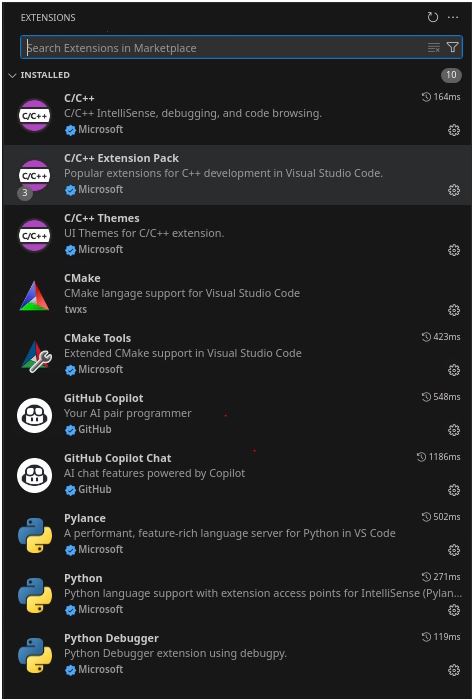
Add few extension, mine are the following:

1


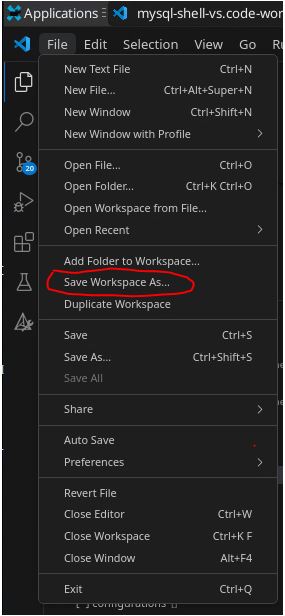
Then open the directory where you have clone the mysql-shell code inside VS and save it as workspace:

2


Then click again on the File and add Folder to workspace and add mysql-shell-plugin/demo directory. 


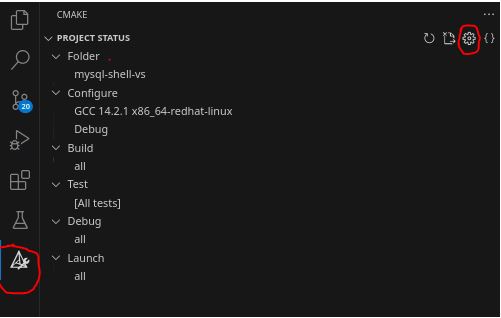
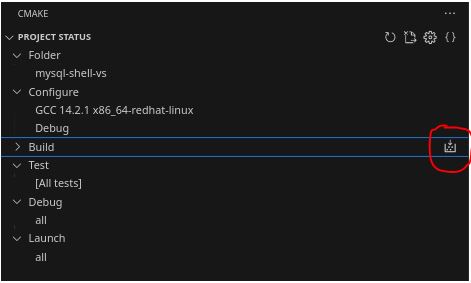
Now we need to configure the cmake side of the project:

3


Click on the icon on the left first then on the settings wheel to open the specific menu. 

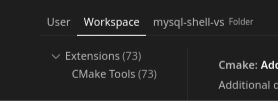
I suggest you to change things at workspace level choosing the workspace tab:

4


Look for the Cmake: Build Directory option and set it to /<add full path>/mysql_source/mysql-shell-build-vs as outlined before. 

Then look for the Cmake: Configure Settings option and click on edit settings.json and set as follow:
"cmake.configureSettings": {

"MYSQL_SOURCE_DIR":"/<add full path>/mysql_source/mysql-server/",

"MYSQL_BUILD_DIR":"/<add full path>/mysql_source/mysql-8.4.4",

"HAVE_PYTHON":true,

"BUNDLED_POLYGLOT_DIR":0,

"WITH_TESTS":true,

"CMAKE_BUILD_TYPE":"Debug",

},

The above will create the Cmake configuration and structure in /<add full path>/mysql_source/mysql-shell-build-vs. 


Once this is done compile the project clicking on the small icon close to build

5

This will build the whole project, sit down and relax while compilation will complete. 


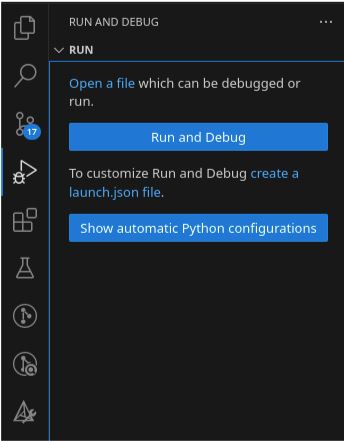
Once this is complete click on the run-and-debug  icon:
6

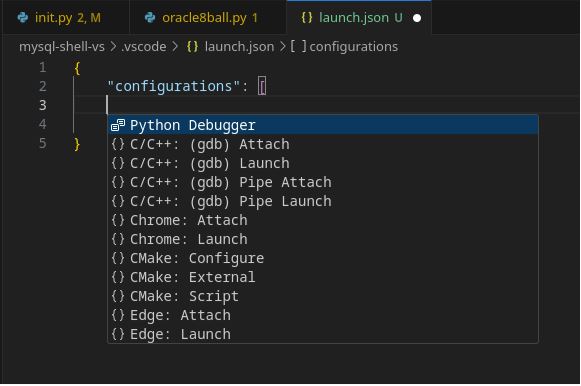
Then click on create a launch.json

Choose mysql-shell-vs:

7


8

Then pick C/C++ gdb Attach.

This will open a json file, we are interested in the values inside the “configurations”, it should be something like this:
      {

            "name": "(gdb) Launch",

            "type": "cppdbg",

            "request": "launch",

            "program": "/<add full path>/mysql_source/mysql-shell-build-vs/bin/mysqlsh",

            "args": [

                "--verbose=1"

            ],

            "stopAtEntry": false,

            "cwd": "/<add full path>/mysql_source/mysql-shell-build-vs/",

            "environment": [{"name": "PYTHONPATH", "value": "PATH to your python directory"}],

            "externalConsole": false,

            "MIMode": "gdb",

            "setupCommands": [

                {

                    "description": "Enable pretty-printing for gdb",

                    "text": "-enable-pretty-printing",

                    "ignoreFailures": true

                },

                {

                    "description": "Set Disassembly Flavor to Intel",

                    "text": "-gdb-set disassembly-flavor intel",

                    "ignoreFailures": true

                }

            ]

        }

After that you need to add the Python debugger information:

      {

            "name": "plugin-p",

            "type": "debugpy",

            "request": "attach",

            "connect": {

                "host": "localhost",

                "port": 5678

            },

            "pathMappings": [

                {

                    "localRoot": "${workspaceFolder}",

                    "remoteRoot": "."

                }

            ],

            "justMyCode": false

        },

As you can see what we will do is to attach the debugger to a process that will spin up inside the code.


Save the file, and in the left panel you will now have the option to run and debug using both debuggers. 

Before running the debug let us do a couple of more things.

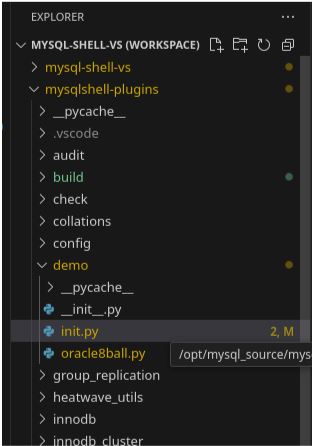
Click on the project explorer and open the init.py file in the demo directory 


9


Before the instruction: import mysqlsh, add this text:

import debugpy

debugpy.listen(("localhost", 5678))

print("Waiting for debugger attach...")

debugpy.wait_for_client()

print("Debugger attached.")

If the module debugpy is not installed do it with:

pip install debugpy

Then before the last line add:

import mysqlsh

shell = mysqlsh.globals.shell


This to create the shell object that is available only internally to the mysql-shell.


Now let us add a couple of breakpoints one in the mysql-shell code and another inside the python code.

In mysql_shell.cc look for:

  for (const auto &dir : plugin_directories) {

    get_plugins(file_list, dir, true);

  }

In mysql-shell 8.4.4 is at line 964.

Put a breakpoint on get_plugins

Then open oracle8ball.py and put a breakpoint on the last line:

 print(answers[index]) 


Run the C/C++ debugger… 

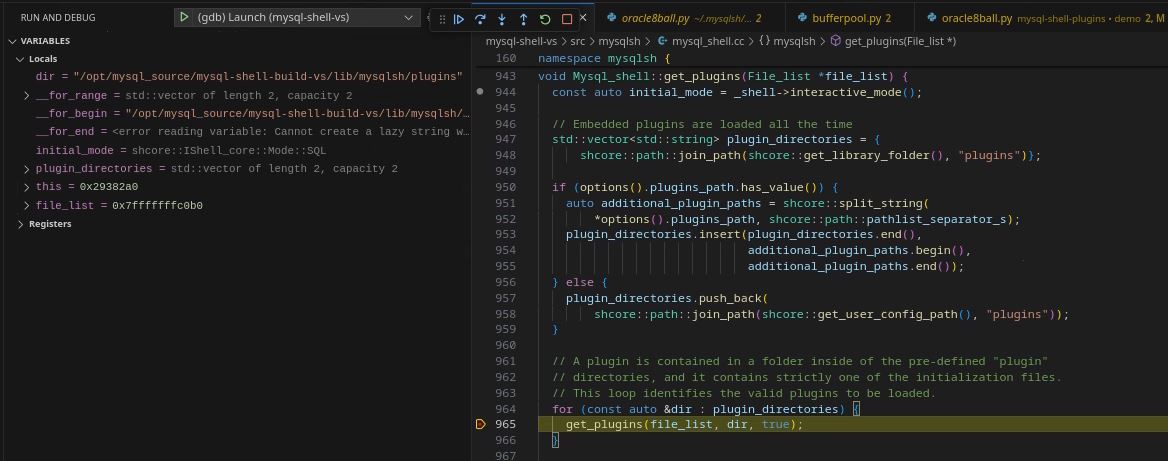
The execution will stop and in the debug left panel you will see the variable informations plus the debug toolbar:

10

This is standard debug for C/C++ projects … Let us click to proceed.

Execution will continue until loading the plugins then will stop. It will hang because the line we have inserted:

debugpy.wait_for_client()


Now run the Python debugger it will connect to the dbugger we defined in the code allowing the process to continue.

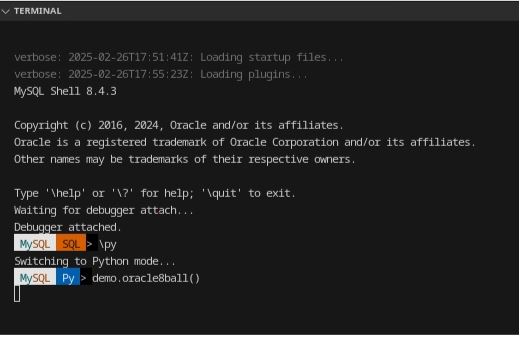
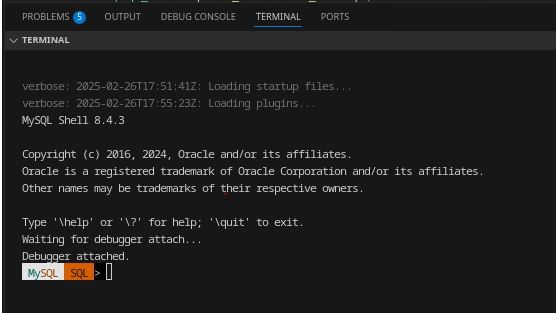
In the terminal window the mysql-shell prompt will appear but not only:

10 1

We can see that the python debugger is now also attached. 


Let us move to python and execute the demo.oracle8ball()

10 2


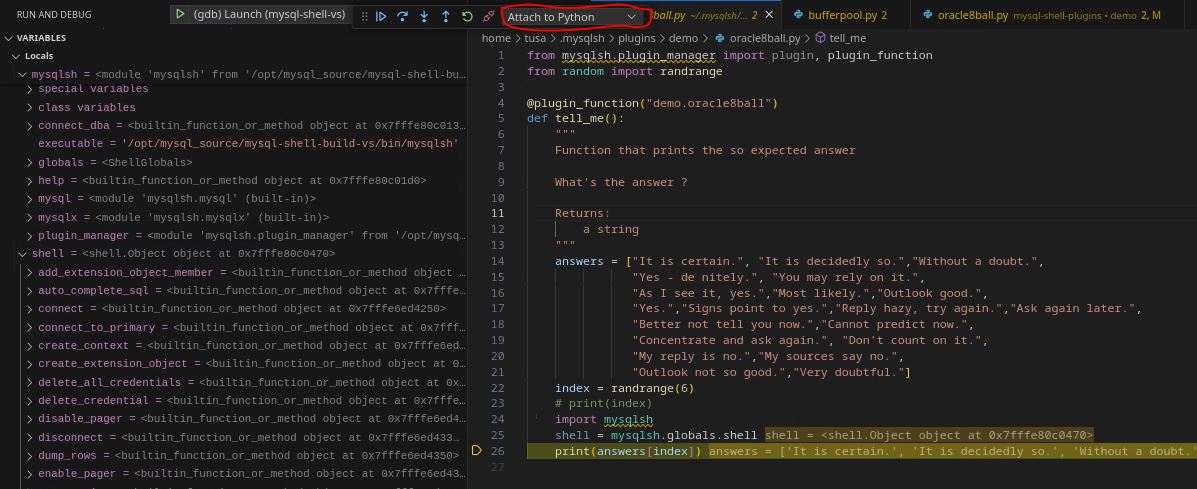
Execution is suspended and our debugger stop at our breakpoint:

11


Please note two things, the first is that also in this case we can see the whole set of information related to local and global variables including the shell object and the other is that the debugger menu shows that now the navigation button refers to the python debugger. 


This level of integration will give anyone a more friendly environment where to develop your mysql-shell extensions. This is particularly important for the ones who wish to standardize and simplify the DBA operation or to give developers easy access to independently and safely perform actions on the databases. 
Tips for Developing MySQL Shell Plugins

Use the MySQL Shell API: MySQL Shell provides a rich API for interacting with MySQL databases. Refer to the official documentation for details.
  • Test Incrementally: Test your plugin functions frequently to catch errors early.
  • Leverage Python Libraries: You can use any Python library in your plugin, so take advantage of the vast Python ecosystem.

Conclusion

Setting up a development environment for MySQL Shell plugins in Python is straightforward. With the right tools and a bit of Python knowledge, you can create powerful extensions to enhance MySQL Shell's functionality. Whether you're automating database tasks or integrating with other systems, MySQL Shell plugins offer endless possibilities.


Happy coding!


No comments on “How to Set Up the Development Environment for MySQL Shell Plugins for Python”

More Articles …

  1. MySQL latest performance review
  2. How to migrate a production database to Percona Everest (MySQL) using Clone
  3. Sakila, Where Are You Going?
  4. Is MySQL Router 8.2 Any Better?
  5. Export and import of MySQL passwords using caching_sha2 
  6. Proof of Concept: Horizontal Write Scaling for MySQL with Kubernetes Operator
  7. Which is the best Proxy for Percona MySQL Operator?
  8. Help! I am out of disk space!
  9. MySQL Dual password how to manage them programmatically
  10. ProxySQL support for MySQL caching_sha2_password
Page 1 of 25
  • Start
  • Prev
  • 1
  • 2
  • 3
  • 4
  • 5
  • 6
  • 7
  • 8
  • 9
  • 10
  • Next
  • End

Related Articles

  • The Jerry Maguire effect combines with John Lennon “Imagine”…
  • About Percona conference in Santa Clara 2016
  • Community dinner @ Pedro’s
  • What I think about the Percona Live conference 2013.
  • MySQL 2012 Percona conference day 2 part 3
  • MySQL 2012 Percona conference day 2 part 2
  • MySQL 2012 Percona conference day 2 part 1
  • My day at MySQL conference 2012 in Santa Clara day 1.
  • Pythian Community Dinner at Pedro
  • A Missed Opportunity?

Path

  1. Home
  2. MySQL Blogs
  3. Reasoning around the recent conferences in 2019

Latest conferences

We have 12854 guests and no members online

login

Remember Me
  • Forgot your username?
  • Forgot your password?
Bootstrap is a front-end framework of Twitter, Inc. Code licensed under MIT License. Font Awesome font licensed under SIL OFL 1.1.