Who is drop-in replacement of
From MySQL to Percona or MariaDB ...and back
As we all know MariaDB starts as a fork of MySQL and then slowly diverges until becoming a different product.
Still I often catch at conferences that MariaDB is a drop-in replacement for MySQL (https://en.wikipedia.org/wiki/Drop-in_replacement). This for me is a bold statement given drop-in-replacement: “It refers to the ability to replace one hardware (or software) component with another one without any other code or configuration changes being required and resulting in no negative impacts”. Which by inheritance also means I can go backwards.
In short if MariaDB is a real drop-in replacement, we should be able to replace the MySQL binaries with the ones coming from MariaDB and then roll back without any issue.
This short article is the result of my notorious disbelieving about any kind of bold marketing statements.
To be clear I am NOT going to compare the functionalities of the different products, I just want to see if I can replace one with the other.
The tests
What and how
For the tests I will use the latest version of:
- MySQL 5.7
- Percona Server 5.7
- MariaDb 10.3
And for the newest:
- MySQL 8.0.22 (8.0.23 is out but PS is not yet, so we cannot compare)
- Percona Server 8.0.22
- MariaDB 10.5
I will have a source pointing to a symbolic link named /opt/mysql_templates/magic then I will replace the target of the link pointing to the different binaries.
What I will do is simple:
- Point to MySQL
- Create a new instance
- Create the world schema and load data (using Innodb)
- Select count(*) from world.City;
- SET GLOBAL innodb_fast_shutdown=0;
- Stop instance
- Point link to Percona
- Start instance
- Select count(*) from world.City;
- Drop world
- Repeat all steps from #3 and point to MariaDB
- Once the MariaDB test is done, point to MySQL and repeat.
Will run the same tests for the 5.7/10.3 series and for the 8.0.22/10.5.
The expectation to be drop-in-replacement is to be able to move from MySQL to Percona Server to MariaDB and back to MySQL. Anything diverging will prove we are NOT dealing with drop-in.
Version 5.7/10.3
MySQL
/opt/mysql_templates/magic/bin/mysql  Ver 14.14 Distrib 5.7.33, for linux-glibc2.12 (x86_64) using  EditLine wrapper
Connection id:		4
Server version:		5.7.33-log MySQL Community Server (GPL)
UNIX socket:		/opt/mysql_instances/magic/mysql.sock
Uptime:			4 sec

+----------+
| count(*) |
+----------+
|     4079 |
+----------+
1 row in set (0.01 sec)
Shift to Percona:
/opt/mysql_templates/magic/bin/mysql  Ver 14.14 Distrib 5.7.33-36, for Linux (x86_64) using  6.0

Connection id:		8
Server version:		5.7.33-36-log Percona Server (GPL), Release 36, Revision 7e403c5
UNIX socket:		/opt/mysql_instances/magic/mysql.sock
Uptime:			5 min 38 sec

+----------+
| count(*) |
+----------+
|     4079 |
+----------+
1 row in set (0.00 sec)
No errors at all in the log
Let us go backwards to MySQL
(root@localhost) [world]>\s
--------------
/opt/mysql_templates/magic/bin/mysql  Ver 14.14 Distrib 5.7.33, for linux-glibc2.12 (x86_64) using  EditLine wrapper

Connection id:		7
Server version:		5.7.33-log MySQL Community Server (GPL)
UNIX socket:		/opt/mysql_instances/magic/mysql.sock
Uptime:			5 min 33 sec

Database changed
+----------+
| count(*) |
+----------+
|     4079 |
+----------+
1 row in set (0.00 sec)
No issue at all
Let us try to move to MariaDB 10.3:
So at first attempt it failed, and had to modify my.cnf removing GTID config as Performance schema (see reference section about that).
Once done:
2021-03-07 10:59:22 0 [ERROR] Missing system table mysql.roles_mapping; please run mysql_upgrade to create it
2021-03-07 10:59:22 0 [ERROR] Incorrect definition of table mysql.event: expected column 'sql_mode' at position 14 to have type set(...), found type set(...)
2021-03-07 10:59:22 0 [ERROR] mysqld: Event Scheduler: An error occurred when initializing system tables. Disabling the Event Scheduler.
Working but needing to run innodb_update, once done, I had a lot of errors related to the Performance schema, and still InnoDB issues:
/opt/mysql_templates/magic/bin/mysql  Ver 15.1 Distrib 10.3.28-MariaDB, for Linux (x86_64) using readline 5.1

Connection id:		76
Server:			MariaDB
Server version:		10.3.28-MariaDB-log MariaDB Server
UNIX socket:		/opt/mysql_instances/magic/mysql.sock
Uptime:			1 min 17 sec

(root@localhost) [(none)]>select count(*) from world.City;
+----------+
| count(*) |
+----------+
|     4079 |
+----------+
1 row in set (0.003 sec)
2021-03-07 11:03:37 229 [ERROR] InnoDB: Column last_update in table `mysql`.`innodb_table_stats` is BINARY(4) NOT NULL but should be INT UNSIGNED NOT NULL (flags mismatch).
2021-03-07 11:03:37 229 [ERROR] InnoDB: Fetch of persistent statistics requested for table `mysql`.`gtid_executed` but the required system tables mysql.innodb_table_stats and mysql.innodb_index_stats are not present or have unexpected structure. Using transient stats instead.
2021-03-07 11:03:38 232 [ERROR] Column count of mysql.proc is wrong. Expected 21, found 20. Created with MariaDB 50733, now running 100328. Please use mysql_upgrade to fix this error
2021-03-07 11:03:38 232 [Note] View `sys`.`x$statements_with_errors_or_warnings`: the version is set to 100328, algorithm restored to be MERGE
2021-03-07 11:03:38 233 [ERROR] InnoDB: Column last_update in table `mysql`.`innodb_table_stats` is BINARY(4) NOT NULL but should be INT UNSIGNED NOT NULL (flags mismatch).
2021-03-07 11:03:38 233 [ERROR] InnoDB: Column last_update in table `mysql`.`innodb_table_stats` is BINARY(4) NOT NULL but should be INT UNSIGNED NOT NULL (flags mismatch).
2021-03-07 11:03:38 233 [ERROR] InnoDB: Column last_update in table `mysql`.`innodb_table_stats` is BINARY(4) NOT NULL but should be INT UNSIGNED NOT NULL (flags mismatch).
Let us go back to MySQL now:
2021-03-07T16:27:01.517996Z 0 [ERROR] Native table 'performance_schema'.'session_variables' has the wrong structure
2021-03-07T16:27:01.518307Z 0 [ERROR] Incorrect definition of table mysql.db: expected column 'User' at position 2 to have type char(32), found type char(80).
2021-03-07T16:27:01.518428Z 0 [ERROR] mysql.user has no `Event_priv` column at position 28
2021-03-07T16:27:01.518697Z 0 [ERROR] Incorrect definition of table mysql.event: expected column 'sql_mode' at position 14 to have type set(...), found type set(...)
2021-03-07T16:27:01.518829Z 0 [ERROR] Event Scheduler: An error occurred when initializing system tables. Disabling the Event Scheduler.
2021-03-07T16:27:01.520065Z 0 [Note] /opt/mysql_templates/magic/bin/mysqld: ready for connections.
Version: '5.7.33-log'  socket: '/opt/mysql_instances/magic/mysql.sock'  port: 3306  MySQL Community Server (GPL)
Try to run mysql_upgrade
mysql@gr1 magic]$ /opt/mysql_templates/magic/bin/mysql_upgrade --defaults-file=./my.cnf -uroot --force
mysql_upgrade: Got error: 1524: Plugin '0' is not loaded while connecting to the MySQL server
Upgrade process encountered error and will not continue.
Only way to access the data at this point is to use skip-grant-tables. But that is unsustainable and in any case I continue to get errors in the log.
Summarizing
Once I have an instance built with MySQL 5.7, I can easily shift to Percona Server 5.7, and eventually go back. I can migrate to MariaDB, but this implies configuration changes and must run mysql_update to modify the core system tables. Finally cannot rollback to MySQL, modifications done by MariaDB are not allowing it.
Version 8/10.5
MySQL
/opt/mysql_templates/magic8/bin/mysql  Ver 8.0.22 for Linux on x86_64 (MySQL Community Server - GPL)

Connection id:		19
Server version:		8.0.22 MySQL Community Server - GPL
UNIX socket:		/opt/mysql_instances/magic8/mysql.sock
Binary data as:		Hexadecimal
Uptime:			22 sec

(root@localhost) [world]>select count(*) from world.City;
+----------+
| count(*) |
+----------+
|     4079 |
+----------+
1 row in set (0.01 sec)
Move to Percona Server
/opt/mysql_templates/magic8/bin/mysql  Ver 8.0.22-13 for Linux on x86_64 (Percona Server (GPL), Release 13, Revision 6f7822f)

Connection id:		23
Server version:		8.0.22-13 Percona Server (GPL), Release 13, Revision 6f7822f
UNIX socket:		/opt/mysql_instances/magic8/mysql.sock
Binary data as:		Hexadecimal
Uptime:			10 min 45 sec

+----------+
| count(*) |
+----------+
|     4079 |
+----------+
1 row in set (0.00 sec)
No error of any type and no changes as for 5.7
Let us rollback to MySQL
/opt/mysql_templates/magic8/bin/mysql  Ver 8.0.22 for Linux on x86_64 (MySQL Community Server - GPL)

Connection id:		18
Server version:		8.0.22 MySQL Community Server - GPL
UNIX socket:		/opt/mysql_instances/magic8/mysql.sock
Binary data as:		Hexadecimal
Uptime:			19 sec

+----------+
| count(*) |
+----------+
|     4079 |
+----------+
1 row in set (0.00 sec)
Perfect and no issue.
Let us now try MariaDB
210308 09:13:34 mysqld_safe Starting mariadbd daemon with databases from /opt/mysql_instances/magic8/data
2021-03-08  9:13:35 0 [ERROR] /opt/mysql_templates/magic8/bin/mariadbd: Error while setting value 'index_merge=on,index_merge_union=on,index_merge_sort_union=on,index_merge_intersection=on,engine_condition_pushdown=on,index_condition_pushdown=on,mrr=on,mrr_cost_based=on,block_nested_loop=on,batched_key_access=off,materialization=on,semijoin=on,loosescan=on,firstmatch=on,duplicateweedout=on,subquery_materialization_cost_based=on,use_index_extensions=on,condition_fanout_filter=on,derived_merge=on' to 'optimizer_switch'
210308 09:13:35 mysqld_safe mysqld from pid file /opt/mysql_instances/magic8/mysqld.pid ended
Ok let see if I remove the optimizer settings:
2021-03-08  9:14:53 0 [ERROR] InnoDB: Invalid flags 0x4800 in /opt/mysql_instances/magic8/data/ibdata1
2021-03-08  9:14:53 0 [ERROR] InnoDB: Plugin initialization aborted with error Data structure corruption
2021-03-08  9:14:53 0 [Note] InnoDB: Starting shutdown...
2021-03-08  9:14:53 0 [ERROR] Plugin 'InnoDB' init function returned error.
2021-03-08  9:14:53 0 [ERROR] Plugin 'InnoDB' registration as a STORAGE ENGINE failed.
2021-03-08  9:14:53 0 [Note] Plugin 'FEEDBACK' is disabled.
2021-03-08  9:14:53 0 [ERROR] Could not open mysql.plugin table: "Table 'mysql.plugin' doesn't exist". Some plugins may be not loaded
2021-03-08  9:14:53 0 [ERROR] /opt/mysql_templates/magic8/bin/mariadbd: unknown variable 'auto-generate-certs=TRUE'
2021-03-08  9:14:53 0 [ERROR] Aborting
210308 09:14:53 mysqld_safe mysqld from pid file /opt/mysql_instances/magic8/mysqld.pid ended
No way to have it working unless a logical dump
Summarizing
As for MySQL 5.7 once I have the instance built with MySQL 8.0.22 I can move to Percona 8.0.22 and roll back with no issues. Moving to MariaDB is not possible at all unless a full LOGICAL dump, which I really want to see how long it could take when you have TeraBytes of data.
Another weirdo
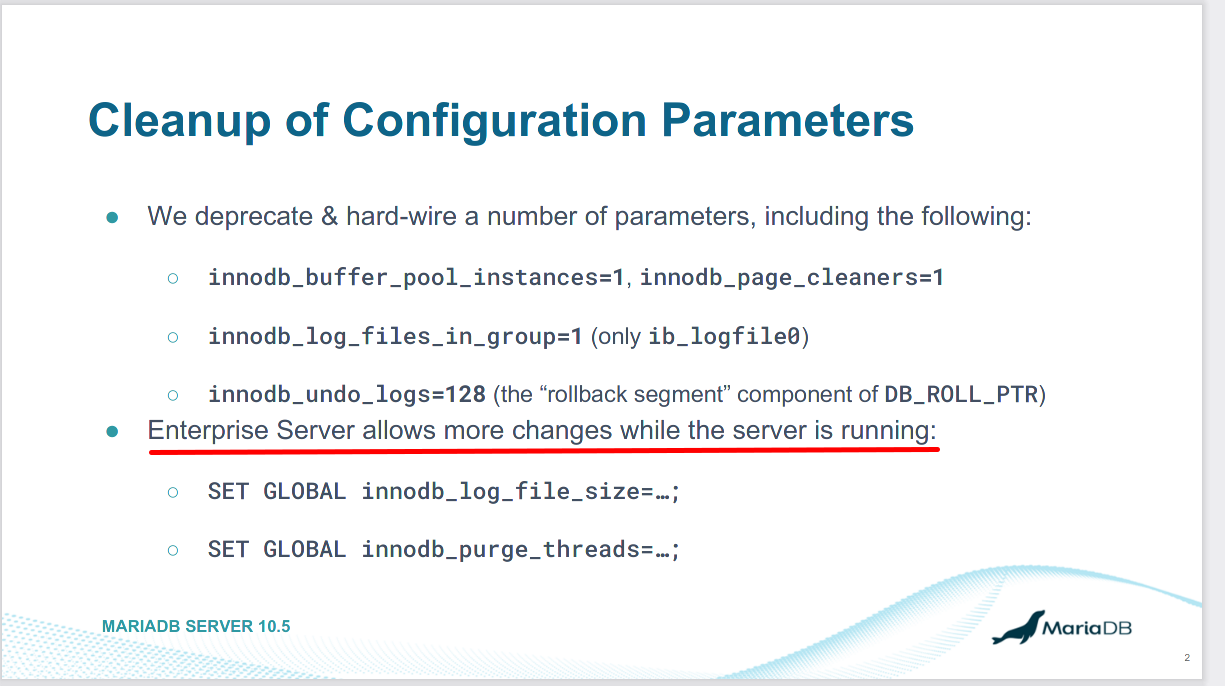
While I was working with MariaDB I also review the documentation and my eyes were capture by this (https://mariadb.com/docs/reference/es/system-variables/innodb_purge_threads/)
“WoW”, I thought, “DYNAMIC settings for innodb_purge_threads this is cool”. Let me try it.
/opt/mysql_templates/mariadb-10.5.9-linux-systemd-x86_64/bin/mysql  Ver 15.1 Distrib 10.5.9-MariaDB, for Linux (x86_64) using readline 5.1

Connection id:		7
Server:			MariaDB
Server version:		10.5.9-MariaDB MariaDB Server
UNIX socket:		/opt/mysql_instances/maria105/mysql.sock
Uptime:			8 min 14 sec


(root@localhost:pm) [(none)]>set global innodb_purge_threads=10;
ERROR 1238 (HY000): Variable 'innodb_purge_threads' is a read only variable
(root@localhost:pm) [(none)]>
Whaaat??
Then I realized I was on the page of “Enterprise Documentation”. Checking with the community version https://mariadb.com/kb/en/innodb-system-variables/#innodb_purge_threads innodb_purge_threads is still NOT dynamic, and after checking even more I also found Innodb_log_file_size, same story.
I was very badly impressed by this, for several reasons but want to mention the two most important:
- MariaDB is declaring over and over to be the one truly open source and community oriented. But where is the support for the community here?
- Is InnoDB not owned by Oracle? Isn't MariaDB using it because Oracle released it under the GPLv2? So why are they modifying the code and not returning it to the open source community? I am not an expert in legal things, but that sounds to me an infringement of the license.
Conclusions
Drop-in replacement has a very specific meaning, and it must be used with caution. It also brings several strings attached, one of these is that replacing binaries is not a one way only solution. Attaching the term limited to drop-in as in MariaDB documentation, it is not correct, it still evokes an inapplicable concept and can be seen as misleading advertising.
As we can see the only real drop-in replacement for MySQL is Percona Server, MariaDB is not even close to it, too many changes in the configuration file, and of course the need to go for a logical dump is not even remotely the right way to go.
In short MariaDB is obviously a different product, as already stated by many in different articles, that is diverging more and more.
The only reason for which MariaDB continues to play the drop-in game with MySQL, for me, is because they continue to use the traction MySQL has on the community and the market, to attract customers. They also absorb from the work done by Oracle and Percona but as shown with innodb_purge_threads/innodb_log_file_size, they do not hesitate to keep significant features only for Enterprise version, without sharing with the community.
As said many times, MariaDB has huge minds in development, starting from Monty down to any level of developer/DBA. We must recognize and respect that, as well we must recognize the great work they do at technical level.
I would love to see more collaboration, but I also understand the need to be something different to survive as a company.
What I cannot accept is when we have claims that are not real like the drop-in replacement (also if limited), or even worse the case of innodb_purge_threads/innodb_log_file_size.
That is wrong and as a strong advocate of open source and a lover of the MySQL/MariaDB community I feel I need to voice my concern.
Great MySQL to all
Reference
https://www.percona.com/resources/webinars/differences-between-mariadb%C2%AE-and-mysql%C2%AE
https://mariadb.com/docs/reference/es/system-variables/innodb_purge_threads/
https://mariadb.com/kb/en/innodb-system-variables/#innodb_purge_threads